Lowe's 2010 Annual Report Download - page 37
Download and view the complete annual report
Please find page 37 of the 2010 Lowe's annual report below. You can navigate through the pages in the report by either clicking on the pages listed below, or by using the keyword search tool below to find specific information within the annual report.-
 1
1 -
2
-
3
-
4
-
5
-
6
-
7
-
8
-
9
-
10
-
11
-
12
-
13
-
14
-
15
-
16
-
17
-
18
-
19
-
20
-
21
-
22
-
23
-
24
-
25
-
26
-
 27
27 -
 28
28 -
 29
29 -
 30
30 -
 31
31 -
 32
32 -
 33
33 -
 34
34 -
 35
35 -
 36
36 -
 37
37 -
 38
38 -
 39
39 -
 40
40 -
 41
41 -
 42
42 -
 43
43 -
 44
44 -
 45
45 -
 46
46 -
 47
47 -
48
-
49
-
50
-
51
-
52
-
53
-
54
-
55
-
56
-
57
-
58
 |
 |

LOWE’S 2010 ANNUAL REPORT 33
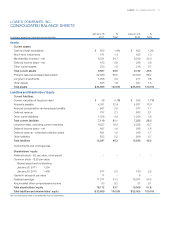
LOWE’S COMPANIES, INC.
CONSOLIDATED STATEMENTS OF CASH FLOWS
(In millions) January 28, January 29
,
January 30
,
Fiscal years ended on 2011
2010 2009
Cash flows from operating activities:
Netearnings $2,010 $1,783 $2,195
Adjustments to reconcile net earnings to net cash provided by operating activities:
Depreciation and amortization 1,684 1,733 1,667
Deferredincometaxes (133) (123) 69
Loss on property and other assets – net 103 193 89
Loss on redemption of long-term debt – – 8
Share-basedpaymentexpense 115 102 95
Changes in operating assets and liabilities:
Merchandise inventory – net (64) (28) (611)
Other operating assets (142) 7 31
Accounts payable 60 175 402
Other operating liabilities 219 212 177
Net cash provided by operating activities 3,852 4,054 4,122
Cash flows from investing activities:
Purchases of investments (2,605) (1,827) (1,358)
Proceeds from sale/maturity of investments 1,822 1,784 1,425
Increase in other long-term assets (97) (62) (56)
Property acquired (1,329) (1,799) (3,266)
Proceeds from sale of property and other long-term assets 25 18 29
Net cash used in investing activities (2,184) (1,886) (3,226)
Cash flows from financing activities:
Net decrease in short-term borrowings – (1,007) (57)
Net proceeds from issuance of long-term debt 1,985 10 15
Repayment of long-term debt (552) (37) (573)
Proceeds from issuance of common stock under share-based payment plans 104 128 174
Cash dividend payments (571) (391) (491)
Repurchase of common stock (2,618) (504) (8)
Excesstaxbenetsofshare-basedpayments 1 – 1
Net cash used in financing activities (1,651) (1,801) (939)
Effect of exchange rate changes on cash 3 20 7
Net increase (decrease) in cash and cash equivalents 20 387 (36)
Cash and cash equivalents, beginning of year 632 245 281
Cash and cash equivalents, end of year $ 652 $ 632 $ 245
See accompanying notes to consolidated financial statements.