Lowe's 2010 Annual Report Download - page 34
Download and view the complete annual report
Please find page 34 of the 2010 Lowe's annual report below. You can navigate through the pages in the report by either clicking on the pages listed below, or by using the keyword search tool below to find specific information within the annual report.-
 1
1 -
2
-
3
-
4
-
5
-
6
-
7
-
8
-
9
-
10
-
11
-
12
-
13
-
14
-
15
-
16
-
17
-
18
-
19
-
20
-
21
-
22
-
23
-
 24
24 -
 25
25 -
 26
26 -
 27
27 -
 28
28 -
 29
29 -
 30
30 -
 31
31 -
 32
32 -
 33
33 -
 34
34 -
 35
35 -
 36
36 -
 37
37 -
 38
38 -
 39
39 -
 40
40 -
 41
41 -
 42
42 -
 43
43 -
 44
44 -
45
-
46
-
47
-
48
-
49
-
50
-
51
-
52
-
53
-
54
-
55
-
56
-
57
-
58
 |
 |

30 LOWE’S 2010 ANNUAL REPORT
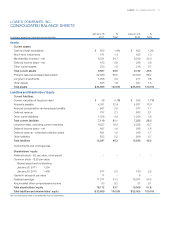
LOWE’S COMPANIES, INC.
CONSOLIDATED STATEMENTS OF EARNINGS
(Inmillions,exceptpershareandpercentagedata) January 28, % January 29, % January 30, %
Fiscal years ended on 2011 Sales 2010 Sales 2009 Sales
Net sales $ 48,815 100.00% $ 47,220 100.00% $ 48,230 100.00%
Cost of sales 31,663 64.86 30,757 65.14 31,729 65.79
Gross margin 17,152 35.14 16,463 34.86 16,501 34.21
Expenses:
Selling, general and administrative 12,006 24.60 11,737 24.85 11,176 23.17
Depreciation 1,586 3.25 1,614 3.42 1,539 3.19
Interest – net 332 0.68 287 0.61 280 0.58
Total expenses 13,924 28.53 13,638 28.88 12,995 26.94
Pre-tax earnings 3,228 6.61 2,825 5.98 3,506 7.27
Incometaxprovision 1,218 2.49 1,042 2.20 1,311 2.72
Net earnings $ 2,010 4.12% $ 1,783 3.78% $ 2,195 4.55%
Basic earnings per common share $ 1.42 $ 1.21 $ 1.50
Diluted earnings per common share $ 1.42 $ 1.21 $ 1.49
Cash dividends per share $ 0.420 $ 0.355 $ 0.335
See accompanying notes to consolidated financial statements.