Lowe's 2010 Annual Report Download - page 26
Download and view the complete annual report
Please find page 26 of the 2010 Lowe's annual report below. You can navigate through the pages in the report by either clicking on the pages listed below, or by using the keyword search tool below to find specific information within the annual report.-
 1
1 -
2
-
3
-
4
-
5
-
6
-
7
-
8
-
9
-
10
-
11
-
12
-
13
-
14
-
15
-
 16
16 -
 17
17 -
 18
18 -
 19
19 -
 20
20 -
 21
21 -
 22
22 -
 23
23 -
 24
24 -
 25
25 -
 26
26 -
 27
27 -
 28
28 -
 29
29 -
 30
30 -
 31
31 -
 32
32 -
 33
33 -
 34
34 -
 35
35 -
 36
36 -
37
-
38
-
39
-
40
-
41
-
42
-
43
-
44
-
45
-
46
-
47
-
48
-
49
-
50
-
51
-
52
-
53
-
54
-
55
-
56
-
57
-
58
 |
 |

22 LOWE’S 2010 ANNUAL REPORT
Income tax provision
Oureffectiveincometaxratewas36.9%in2009versus37.4%in2008.
Thedecreaseintheeffectivetaxratewasprimarilyduetofavorablestate
taxsettlements.
LOWE’S BUSINESS OUTLOOK
As of February 23, 2011, the date of our fourth quarter 2010 earnings
release,weexpectedtotalsalesin2011toincreaseapproximately5%,
whichincludesthe53rdweek.The53rdweekwasexpectedtoincrease
totalsalesbyapproximately1.6%.Weexpectedcomparablestoresales
toincrease1%to2%in2011.Weexpectedtoopen25to30stores
during2011,resultingintotalsquarefootagegrowthofapproximately
1.5%.Earningsbeforeinterestandtaxesasapercentageofsales
(operatingmargin)wasexpectedtoincreaseapproximately30basis
points.Inaddition,depreciationexpensewasexpectedtobeapproxi-
mately$1.48billion.Dilutedearningspershareof$1.60to$1.72were
expectedforthescalyearendingFebruary3,2012.Ourguidance
assumedapproximately$2.4billioninsharerepurchasesduring2011
spread evenly across the four quarters.
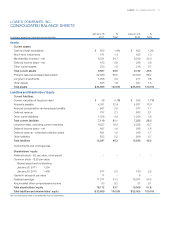
FINANCIAL CONDITION, LIQUIDITY AND
CAPITAL RESOURCES
Cash Flows
Cashowsfromoperatingactivitiescontinuedtoprovidetheprimary
source of our liquidity. The decrease in net cash provided by operating
activities for 2010 versus 2009 was driven by changes in working capital,
primarilyrelatedtoaccountspayableandincometaxpayments.The
increase in net cash used in investing activities for 2010 versus 2009
was driven by increased purchases of investments, partially offset by
adeclineinpropertyacquiredduetoareductioninourstoreexpansion
program. The decrease in net cash used in financing activities for 2010
versus 2009 was attributable to an increase in cash from the issuances
of long-term debt in 2010 and lower debt repayments, offset by
share repurchases.
Sources of Liquidity
Inadditiontoourcashowsfromoperations,liquidityisprovidedbyour
short-term borrowing facilities and through the issuance of long-term
debt.Wehavea$1.75billionseniorcreditfacilitythatexpiresinJune
2012. The senior credit facility supports our commercial paper program.
Theseniorcreditfacilityhasa$500millionletterofcreditsublimit.Letters
of credit issued pursuant to the senior credit facility reduce the amount
available for borrowing under the senior credit facility. Borrowings made
areunsecuredandarepricedatxedratesbaseduponmarketcondi-
tions at the time of funding in accordance with the terms of the senior
credit facility. The senior credit facility contains certain restrictive covenants,
which include maintenance of a debt leverage ratio, as defined by the
senior credit facility. We were in compliance with those covenants at
January 28, 2011. Seventeen banking institutions are participating in the
senior credit facility. There were no outstanding borrowings or letters
of credit under the senior credit facility and no outstanding borrowings
under the commercial paper program at January 28, 2011 or during 2010.
WealsohaveaCanadiandollar(C$)denominatedcreditfacilityin
theamountofC$50millionthatprovidesrevolvingcreditsupportforour
Canadian operations. This uncommitted credit facility provides us with
theabilitytomakeunsecuredborrowings,whicharepricedatxedrates
based upon market conditions at the time of funding in accordance
with the terms of the credit facility. As of January 28, 2011, there were
no borrowings outstanding under this credit facility.
Weexpecttocontinuetohaveaccesstothecapitalmarketsonboth
short- and long-term bases when needed for liquidity purposes by
issuing commercial paper or new long-term debt. The availability and the
borrowing costs of these funds could be adversely affected, however,
by a downgrade of our debt ratings or a deterioration of certain financial
ratios.ThetablebelowreectsourdebtratingsbyStandard&Poor’s
(S&P)andMoody’sasofMarch28,2011,whichwearedisclosingto
enhance understanding of our sources of liquidity and the effect of our
ratingsonourcostoffunds.Althoughwecurrentlydonotexpecta
downgrade in our debt ratings, our commercial paper and senior debt
ratings may be subject to revision or withdrawal at any time by the
assigning rating organization, and each rating should be evaluated
independently of any other rating.
Debt Ratings S&P Moody’s
Commercial Paper A1 P1
Senior Debt A A1
Outlook Stable Stable
We believe that net cash provided by operating and financing
activitieswillbeadequateforourexpansionplansandourother
operatingrequirementsoverthenext12months.Therearenoprovisions
inanyagreementsthatwouldrequireearlycashsettlementofexisting
debt or leases as a result of a downgrade in our debt rating or a decrease
in our stock price. In addition, we do not have a significant amount of
cash held in foreign affiliates.
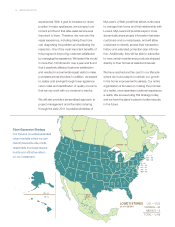
Cash Requirements
Capital expenditures
Ourscal2011capitalbudgetisapproximately$1.8billion,inclusive
ofapproximately$100millionofleasecommitments,resultingina
plannednetcashoutowof$1.7billion.Approximately45%ofthe
plannednetcashoutowisforstoreexpansion.Ourexpansionplans
for2011consistof25to30newstoresandareexpectedtoincrease
salesoorsquarefootagebyapproximately1.5%.Allofthe2011
projectsareexpectedtobeowned,whichincludesapproximately
20%ofthestoresonleasedland.Inaddition,approximately30%
oftheplannednetcashoutowisforinvestmentinourexisting
stores.Otherplannedcapitalexpendituresincludeinvestinginour
distribution and corporate infrastructure, including enhancements
in information technology.
During 2009, we entered into a joint venture agreement with
Australian retailer Woolworths Limited, to develop a chain of home
improvementstoresinAustralia.Weexpecttocontributeapproximately
$400millionoverfouryearstothejointventure,ofwhichweareaone-
thirdowner.AsofJanuary28,2011,wehadcontributedapproximately
$140million.Thejointventureexpectstoopenitsrststoresin2011.
Debt and capital
InApril2010,weissued$1.0billionofunsecurednotesintwotranches:
$500millionof4.625%notesmaturinginApril2020and$500million
of 5.8% notes maturing in April 2040. Net proceeds from the 4.625%
and5.8%notes,excludingissuancecosts,were$497millionand
$495million,respectively.Duringthesecondquarterof2010,we