Lowe's 2010 Annual Report Download - page 35
Download and view the complete annual report
Please find page 35 of the 2010 Lowe's annual report below. You can navigate through the pages in the report by either clicking on the pages listed below, or by using the keyword search tool below to find specific information within the annual report.-
 1
1 -
2
-
3
-
4
-
5
-
6
-
7
-
8
-
9
-
10
-
11
-
12
-
13
-
14
-
15
-
16
-
17
-
18
-
19
-
20
-
21
-
22
-
23
-
24
-
 25
25 -
 26
26 -
 27
27 -
 28
28 -
 29
29 -
 30
30 -
 31
31 -
 32
32 -
 33
33 -
 34
34 -
 35
35 -
 36
36 -
 37
37 -
 38
38 -
 39
39 -
 40
40 -
 41
41 -
 42
42 -
 43
43 -
 44
44 -
 45
45 -
46
-
47
-
48
-
49
-
50
-
51
-
52
-
53
-
54
-
55
-
56
-
57
-
58
 |
 |

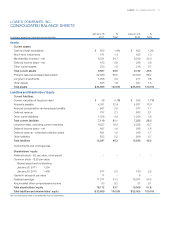
LOWE’S 2010 ANNUAL REPORT 31
LOWE’S COMPANIES, INC.
CONSOLIDATED BALANCE SHEETS
January 28,
%
January 29,
%
(Inmillions,exceptparvalueandpercentagedata) 2011
Total
2010 Total
Assets
Current assets:
Cashandcashequivalents $ 652 1.9% $ 632 1.9%
Short–term investments 471 1.4 425 1.3
Merchandise inventory – net 8,321 24.7 8,249 25.0
Deferredincometaxes–net 193 0.6 208 0.6
Other current assets 330 1.0 218 0.7
Total current assets 9,967 29.6 9,732 29.5
Property, less accumulated depreciation 22,089 65.5 22,499 68.2
Long-term investments 1,008 3.0 277 0.8
Other assets 635 1.9 497 1.5
Total assets $ 33,699 100.0% $ 33,005 100.0%
Liabilities and Shareholders’ Equity
Current liabilities:
Currentmaturitiesoflong-termdebt $ 36 0.1% $ 552 1.7%
Accounts payable 4,351 12.9 4,287 13.0
Accrued compensation and employee benefits 667 2.0 577 1.7
Deferred revenue 707 2.1 683 2.1
Other current liabilities 1,358 4.0 1,256 3.8
Total current liabilities 7,119 21.1 7,355 22.3
Long-termdebt,excludingcurrentmaturities 6,537 19.4 4,528 13.7
Deferredincometaxes–net 467 1.4 598 1.8
Deferredrevenue–extendedprotectionplans 631 1.9 549 1.7
Other liabilities 833 2.5 906 2.7
Total liabilities 15,587 46.3 13,936 42.2
Commitments and contingencies
Shareholders’ equity:
Preferredstock–$5parvalue,noneissued – – – –
Commonstock–$.50parvalue;
Shares issued and outstanding
January 28, 2011 1,354
January 29, 2010 1,459 677 2.0 729 2.2
Capitalinexcessofparvalue 11 – 6 –
Retained earnings 17,371 51.5 18,307 55.5
Accumulated other comprehensive income 53 0.2 27 0.1
Total shareholders’ equity 18,112 53.7 19,069 57.8
Total liabilities and shareholders’ equity $ 33,699 100.0% $ 33,005 100.0%
See accompanying notes to consolidated financial statements.