Lowe's 2010 Annual Report Download - page 24
Download and view the complete annual report
Please find page 24 of the 2010 Lowe's annual report below. You can navigate through the pages in the report by either clicking on the pages listed below, or by using the keyword search tool below to find specific information within the annual report.-
 1
1 -
2
-
3
-
4
-
5
-
6
-
7
-
8
-
9
-
10
-
11
-
12
-
13
-
 14
14 -
 15
15 -
 16
16 -
 17
17 -
 18
18 -
 19
19 -
 20
20 -
 21
21 -
 22
22 -
 23
23 -
 24
24 -
 25
25 -
 26
26 -
 27
27 -
 28
28 -
 29
29 -
 30
30 -
 31
31 -
 32
32 -
 33
33 -
 34
34 -
35
-
36
-
37
-
38
-
39
-
40
-
41
-
42
-
43
-
44
-
45
-
46
-
47
-
48
-
49
-
50
-
51
-
52
-
53
-
54
-
55
-
56
-
57
-
58
 |
 |

20 LOWE’S 2010 ANNUAL REPORT
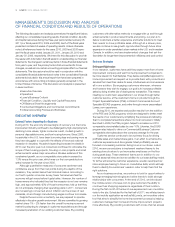
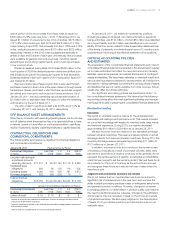
Other Metrics 2010 2009 2008
Comparable store sales
increase (decrease) 2 1.3% (6.7)% (7.2)%
Total customer transactions (in millions) 786 766 740
Average ticket 3 $62.07 $61.66 $65.15
At end of year:
Number of stores 1,749 1,710 1,649
Salesoorsquarefeet(inmillions) 197 193 187
Average store size selling square
feet (in thousands) 4
113 113 113
Return on average assets 5 5.8% 5.3% 6.8%
Return on average shareholders’ equity 6 10.7% 9.5% 12.7%
1 EBIT margin, also referred to as operating margin, is defined as earnings before interest and taxes as a
percentage of sales.
2 A comparable store is defined as a store that has been open longer than 13 months. A store that is identified
for relocation is no longer considered comparable one month prior to its relocation. The relocated store must
then remain open longer than 13 months to be considered comparable.
3 Average ticket is defined as net sales divided by the total number of customer transactions.
4 Average store size selling square feet is defined as sales floor square feet divided by the number of stores
open at the end of the period.
5 Return on average assets is defined as net earnings divided by average total assets for the last five quarters.
6 Return on average shareholders’ equity is defined as net earnings divided by average shareholders’ equity for
the last five quarters.
Fiscal 2010 Compared to Fiscal 2009
Net sales
Netsalesincreased3.4%to$48.8billionin2010.Comparablestore
sales increased 1.3% in 2010 compared to a decline of 6.7% in 2009.
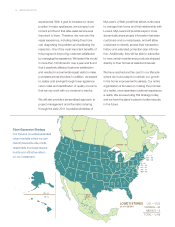
Weexperiencedcomparablestoresalesincreasesover2009foreach
quarter and saw evidence of economic stabilization, as comparable
store sales performance was more balanced across geographic markets
in 2010. Comparable store customer transactions increased 0.9%,
and comparable store average ticket increased 0.5% versus 2009,
as larger project sales remained slow for the year.
Overall, while growth in household spending moderately accelerated
late in the year, it remained constrained by high unemployment, modest
income growth, lower housing wealth and tight credit. As a result,
customers continued to focus on non-discretionary and smaller dis-
cretionaryprojectsduring2010.Thisfocuswasreectedbystrength
incategoriesthatsupportsmallerprojectssuchastoolsandlawn&
landscape products, both of which outperformed the company average.
Meanwhile, categories that are more discretionary in nature such as
fashionplumbing,cabinets&countertopsandhomefashionwere
negatively impacted by the remaining market uncertainty and performed
below the company average.
We seized opportunities during the year to drive additional sales
byquicklyexecutingprogramsthathelpedcustomersbenetfrom
government incentives. The Cash for Appliances rebate program, as
well as our continued focus on market-specific assortments to ensure
that we have the right products in the right markets, helped drive
comparable store sales increases above the company average for our
appliances category. In addition, our PSE program, along with focused
Special Order Sales promotions, helped customers take advantage of
thehighertaxcreditsforenergy-efcientimprovementsthatexpired
at the end of the year. The PSE program also helped us to increase
our 2010 comparable store installed sales over 10%, with the greatest
growth occurring in millwork, lumber and building materials.
Comparable store sales for our seasonal living category also
outperformed the company average for 2010. The increase was driven
by improved sell-through of grills and grill accessories, patio furniture
and holiday assortments, as well as increased sales of room air
conditionersasaresultofprolongedextremeheatacrosstheU.S.in
the middle of the year.
Gross margin
Gross margin of 35.14% for 2010 represented a 28 basis point
increase over 2009. The increase was driven by improvements in
margin rates, primarily in seasonal living, lumber and hardware which
resulted in 38 basis points of improvement. The rate increase is primarily
attributable to better sell-through of seasonal inventory this year
relative to 2009, our increased number of competitive pricing zones,
and our Base Price Optimization strategy. The rate improvement
was partially offset by a 17 basis point unfavorable impact from the
mixofproductssoldacrosscategories,drivenbyincreasedsales
in appliances.
SG&A
ThedecreaseinSG&Aasapercentageofsalesfrom2009to2010
wasprimarilydrivenbyleverageof23basispointsinbonusexpense,
due to lower attainment levels relative to plan. Impairment and discon-
tinuedprojectexpenseleveraged13basispointsduetolowercharges
associatedwithexistingstoresaswellasfewerconstructionprojects
discontinuedinthecurrentyear.Wealsoexperiencedninebasis
points of leverage associated with our proprietary credit programs
due to decreased program costs for the year. This was partially offset by
de-leverage in store payroll due to the impact of the new Facilities
ServiceAssociate(FSA)positionandwagegrowth,eetexpense
due to increased deliveries related to free delivery promotions and
increasedaveragefuelcosts,andbankcardexpenseduetoincreased
bank card transaction volume and higher transaction fees.
Depreciation
Depreciationexpensedecreasedslightlyfor2010comparedto2009
due to a lower asset base resulting from decreased capital spending
and assets becoming fully depreciated in 2010. Property, less accu-
mulateddepreciation,decreasedto$22.1billionatJanuary28,2011
comparedto$22.5billionatJanuary29,2010.AtJanuary28,2011
and January 29, 2010, we owned 89% and 88% of our stores,
respectively, which included stores on leased land.
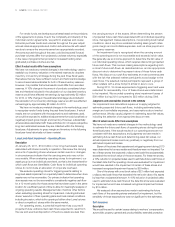
Interest
Netinterestexpenseiscomprisedofthefollowing:
(In millions) 2010 2009
Interestexpense,netofamountcapitalized $340 $300
Amortization of original issue discount and
loan costs 4 4
Interest income (12) (17)
Interest – net $332 $287
Netinterestexpenseincreasedprimarilyasaresultoftheissuance
of$2.0billionofnotesduring2010andthecomparisontotheimpact
oftaxsettlementsthatfavorablyimpactedourtax-relatedinterest
accrualsin2009,offsetbytherepaymentof$500millionofnotes
during the year.