Lowe's 2010 Annual Report Download - page 55
Download and view the complete annual report
Please find page 55 of the 2010 Lowe's annual report below. You can navigate through the pages in the report by either clicking on the pages listed below, or by using the keyword search tool below to find specific information within the annual report.-
 1
1 -
2
-
3
-
4
-
5
-
6
-
7
-
8
-
9
-
10
-
11
-
12
-
13
-
14
-
15
-
16
-
17
-
18
-
19
-
20
-
21
-
22
-
23
-
24
-
25
-
26
-
27
-
28
-
29
-
30
-
31
-
32
-
33
-
34
-
35
-
36
-
37
-
38
-
39
-
40
-
41
-
42
-
43
-
44
-
 45
45 -
 46
46 -
 47
47 -
 48
48 -
 49
49 -
 50
50 -
 51
51 -
 52
52 -
 53
53 -
 54
54 -
 55
55 -
 56
56 -
 57
57 -
 58
58
 |
 |

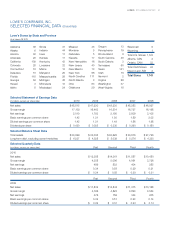
LOWE’S 2010 ANNUAL REPORT 51
February 2, February 3, January 28, January 30, January 31, February 1,
2007 2006* 2005 2004 2003 2002
1 1,385 1,234 1,087 952 828 718 1
2 157.1 140.1 123.7 108.8 94.7 80.7 2
3 210,142 185,314 161,964 147,052 120,692 107,404 3
4 680 639 575 521 460 394 4
5Averagepurchase (1.7) $ 62.07 $ 61.66 $ 65.15 $ 67.05 5 $ 68.98 $ 67.67 $ 63.43 $ 59.21 $ 56.80 $ 55.05 5
6 $ 46,927 $ 43,243 $ 36,464 $ 30,838 $ 26,112 $ 21,714 6
7 1,162 980 859 739 617 509 7
8 154 158 176 180 182 174 8
9 4,998 4,496 3,520 2,908 2,362 1,535 9
10Incometaxprovision NM 1,218 1,042 1,311 1,702 10 1,893 1,731 1,353 1,101 889 566 10
11 3,105 2,765 2,167 1,807 1,473 969 11
12Earningsfromdiscontinuedoperations,netoftax 12 – – – 15 12 13 12
13 3,105 2,765 2,167 1,822 1,485 982 13
14 276 171 116 87 66 60 14
15Earningsretained (11.3) $ 1,422 $ 1,261 $ 1,704 $ 2,381 15 $ 2,829 $ 2,594 $ 2,051 $ 1,735 $ 1,419 $ 922 15
16Sales 5.3 $ 34.79 $ 32.25 $ 32.85 $ 32.04 16 $ 30.00 $ 26.91 $ 22.55 $ 18.91 $ 16.12 $ 13.49 16
17 1.98 1.73 1.35 1.13 0.93 0.62 17
18 0.18 0.11 0.08 0.06 0.04 0.04 18
19 1.80 1.62 1.27 1.07 0.89 0.58 19
20Shareholders’equity 7.7 $ 12.91 $ 13.03 $ 12.30 $ 10.68 20 $ 10.05 $ 8.90 $ 7.11 $ 6.25 $ 5.08 $ 4.09 20
21 1.91 2.05 1.96 1.96 1.93 1.93 21
22 6.62% 6.39% 5.94% 5.91% 5.69% 4.52% 22
23 11.87% 12.11% 10.91% 10.59% 10.14% 7.92% 23
24 20.69% 21.44% 19.99% 19.79% 20.05% 16.33% 24
25Totalcurrentassets 5.2 $ 9,967 $ 9,732 $ 9,190 $ 8,633 25 $ 8,273 $ 7,753 $ 6,842 $ 6,418 $ 5,333 $ 4,798 25
26 796 876 813 1,624 1,126 853 26
27 7,144 6,635 5,850 4,482 3,911 3,611 27
28 18,971 16,354 13,911 11,819 10,245 8,565 28
29 27,726 24,604 21,077 18,647 15,767 13,526 29
30 6,108 5,449 5,337 3,908 3,180 2,808 30
31 3,524 2,832 2,695 2,212 1,791 1,589 31
32Long-termdebt(excludingcurrentmaturities) 13.3 6,537 4,528 5,039 5,576 32 4,325 3,499 3,060 3,678 3,736 3,734 32
33 12,001 10,308 9,579 8,459 7,541 6,942 33
34 $ 15,725 $ 14,296 $ 11,498 $ 10,188 $ 8,226 $ 6,584 34
35Equity/long-termdebt(excludingcurrentmaturities) 2.77 4.21 3.58 2.89 35 3.64 4.09 3.76 2.77 2.20 1.76 35
36 1.76 1.72 1.83 1.83 1.92 2.05 36
37 29,439 27,427 27,071 26,553 25,405 19,277 37
38 1,525 1,568 1,548 1,575 1,564 1,551 38
39 1,564 1,607 1,617 1,631 1,620 1,610 39
40Bookvaluepershare $ 13.38 $ 13.07 $ 12.28 $ 11.04 40 $ 10.31 $ 9.12 $ 7.43 $ 6.47 $ 5.26 $ 4.25 40
41High $ 28.54 $ 24.50 $ 28.49 $ 35.74 41 $ 34.83 $ 34.85 $ 30.27 $ 30.21 $ 25.00 $ 24.44 41
42Low $ 19.35 $ 13.00 $ 15.76 $ 21.01 42 $ 26.15 $ 25.36 $ 22.95 $ 16.69 $ 16.25 $ 12.40 42
43ClosingpriceDecember31 $ 25.08 $ 23.39 $ 21.52 $ 22.62 43 $ 31.15 $ 33.33 $ 28.80 $ 27.70 $ 18.75 $ 23.21 43
44 17 20 22 27 27 40 44
45 13 15 17 15 17 20 45
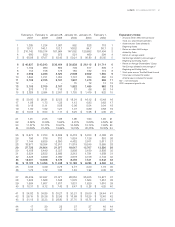
Explanatory Notes:
1 Amounts herein reflect the Contractor
Yards as a discontinued operation.
2 Asset turnover: Sales divided by
Beginning Assets
3 Return on sales: Net Earnings
divided by Sales
4 Return on average assets:
Net Earnings divided by the average of
Beginning and Ending Assets
5 Return on Average Shareholders’ Equity:
Net Earnings divided by the average of
Beginning and Ending Equity
6 Stock price source: The Wall Street Journal
* Fiscal year contained 53 weeks.
All other years contained 52 weeks.
NM = not meaningful
CGR = compound growth rate