Lowe's 2010 Annual Report Download - page 42
Download and view the complete annual report
Please find page 42 of the 2010 Lowe's annual report below. You can navigate through the pages in the report by either clicking on the pages listed below, or by using the keyword search tool below to find specific information within the annual report.-
 1
1 -
2
-
3
-
4
-
5
-
6
-
7
-
8
-
9
-
10
-
11
-
12
-
13
-
14
-
15
-
16
-
17
-
18
-
19
-
20
-
21
-
22
-
23
-
24
-
25
-
26
-
27
-
28
-
29
-
30
-
31
-
 32
32 -
 33
33 -
 34
34 -
 35
35 -
 36
36 -
 37
37 -
 38
38 -
 39
39 -
 40
40 -
 41
41 -
 42
42 -
 43
43 -
 44
44 -
 45
45 -
 46
46 -
 47
47 -
 48
48 -
 49
49 -
 50
50 -
 51
51 -
 52
52 -
53
-
54
-
55
-
56
-
57
-
58
 |
 |

38 LOWE’S 2010 ANNUAL REPORT
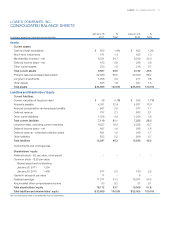
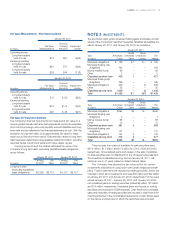
Assets and Liabilities That are Measured at Fair Value
on a Recurring Basis
The following tables present the Company’s financial assets measured
at fair value on a recurring basis as of January 28, 2011 and January 29,
2010, classified by fair value hierarchy:
Fair Value Measurements
at Reporting Date Using
Quoted Prices Significant
in Active Other Significant
Markets for Observable Unobservable
January 28, Identical Assets Inputs Inputs
(In millions)
2011 (Level 1) (Level 2) (Level 3)
Available-for-sale
securities:
Municipal
obligations $ 190 $ – $ 190 $ –
Municipaloating
rate obligations 163 – 163 –
Money market
funds 66 66 – –
Other 2 2 – –
Trading securities:
Mutual funds 50 50 – –
Total short-term
investments $ 471 $118 $ 353 $ –
Available-for-sale
securities:
Municipaloating
rateobligations $ 765 $ – $ 765 $ –
Municipal
obligations 208 – 208 –
Other 35 – 35 –
Total long-term
investments $1,008 $ – $1,008 $ –
Fair Value Measurements
at Reporting Date Using
Quoted Prices Significant
in Active Other Significant
Markets for Observable Unobservable
January 29, Identical Assets Inputs Inputs
(In millions)
2010 (Level 1) (Level 2) (Level 3)
Available-for-sale
securities:
Municipal
obligations $296 $ – $296 $ –
Municipaloating
rate obligations 7 – 7 –
Money market
funds 68 68 – –
Other 12 2 10 –
Trading securities:
Mutual funds 42 42 – –
Total short-term
investments $425 $112 $313 $ –
Available-for-sale
securities:
Municipaloating
rateobligations $141 $ – $141 $ –
Municipal
obligations 136 – 136 –
Total long-term
investments $277 $ – $277 $ –
When available, quoted prices are used to determine fair value.
When quoted prices in active markets are available, investments are
classified within Level 1 of the fair value hierarchy. When quoted prices
in active markets are not available, fair values are determined using
pricing models, and the inputs to those pricing models are based on
observable market inputs. The inputs to the pricing models are typically
benchmark yields, reported trades, broker-dealer quotes, issuer spreads
and benchmark securities, among others.
Assets and Liabilities That are Measured at Fair Value
on a Non-recurring Basis
For the years ended January 28, 2011 and January 29, 2010, the
Company’s only significant assets or liabilities measured at fair value
on a non-recurring basis subsequent to their initial recognition were
certain assets subject to long-lived asset impairment.
The Company reviews the carrying amounts of long-lived assets
whenever events or changes in circumstances indicate that the carrying
amounts may not be recoverable. An impairment loss is recognized
when the carrying amount of the long-lived asset is not recoverable
andexceedsitsfairvalue.TheCompanyestimatedthefairvaluesof
long-lived assets based on the Company’s own judgments about the
assumptions that market participants would use in pricing the asset and
on observable market data, when available. The Company classified
these fair value measurements as Level 3.
In the determination of impairment for operating stores, the
Company determined the fair values of individual operating stores
using an income approach, which required discounting projected
futurecashows.Whendeterminingthestreamofprojectedfuture
cashowsassociatedwithanindividualoperatingstore,management
made assumptions, incorporating local market conditions, about
key store variables, including sales growth rates, gross margin and
controllableexpensessuchasstorepayrollandoccupancyexpense.
Inordertocalculatethepresentvalueofthosefuturecashows,the
Companydiscountedcashowestimatesataratecommensurate
with the risk that selected market participants would assign to the
cashows.Theselectedmarketparticipantsrepresentagroupof
other retailers with a store footprint similar in size to the Company’s.
Inthedeterminationofimpairmentforexcesspropertiesheld-for-
use and held-for-sale, which consist of retail outparcels and property
associated with relocated or closed stores, the fair values were
determined using a market approach based on estimated selling prices.
The Company determined the estimated selling prices by obtaining
information from brokers in the specific markets being evaluated.
The information included comparable sales of similar assets and
assumptions about demand in the market for these assets.
The following tables present such assets measured at fair value
on a non-recurring basis and any resulting realized losses included in
earnings. Because long-lived assets are not measured at fair value on
a recurring basis, certain carrying amounts and fair value measurements
presentedinthetablemayreectvaluesatearliermeasurementdates
and may no longer represent the fair values at January 28, 2011 and
January 29, 2010.