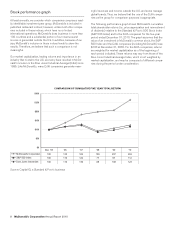
McDonalds 2010 Annual Report Download - page 11
Download and view the complete annual report
Please find page 11 of the 2010 McDonalds annual report below. You can navigate through the pages in the report by either clicking on the pages listed below, or by using the keyword search tool below to find specific information within the annual report.-
 1
1 -
 2
2 -
 3
3 -
 4
4 -
 5
5 -
 6
6 -
 7
7 -
 8
8 -
 9
9 -
 10
10 -
 11
11 -
 12
12 -
 13
13 -
 14
14 -
 15
15 -
 16
16 -
 17
17 -
 18
18 -
 19
19 -
 20
20 -
 21
21 -
 22
22 -
23
-
24
-
25
-
26
-
27
-
28
-
29
-
30
-
31
-
32
-
33
-
34
-
35
-
36
-
37
-
38
-
39
-
40
-
41
-
42
-
43
-
44
-
45
-
46
-
47
-
48
-
49
-
50
-
51
-
52
 |
 |

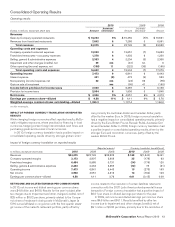
Management’s Discussion and Analysis of
Financial Condition and Results of Operations
Overview
DESCRIPTION OF THE BUSINESS
The Company franchises and operates McDonald’s restaurants.
Of the 32,737 restaurants in 117 countries at year-end 2010,
26,338 were franchised or licensed (including 19,279 franchised
to conventional franchisees, 3,485 licensed to developmental
licensees and 3,574 licensed to foreign affiliates (affiliates)—
primarily Japan) and 6,399 were operated by the Company.
Under our conventional franchise arrangement, franchisees pro-
vide a portion of the capital required by initially investing in the
equipment, signs, seating and décor of their restaurant busi-
nesses, and by reinvesting in the business over time. The
Company owns the land and building or secures long-term leases
for both Company-operated and conventional franchised restau-
rant sites. This maintains long-term occupancy rights, helps
control related costs and assists in alignment with franchisees. In
certain circumstances, the Company participates in reinvestment
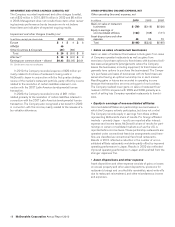
for conventional franchised restaurants. Under our developmental
license arrangement, licensees provide capital for the entire
business, including the real estate interest, and the Company has
no capital invested. In addition, the Company has an equity
investment in a limited number of affiliates that invest in real
estate and operate and/or franchise restaurants within a market.
We view ourselves primarily as a franchisor and believe fran-
chising is important to delivering great, locally-relevant customer
experiences and driving profitability. However, directly operating
restaurants is paramount to being a credible franchisor and is
essential to providing Company personnel with restaurant oper-
ations experience. In our Company-operated restaurants, and in
collaboration with franchisees, we further develop and refine
operating standards, marketing concepts and product and pricing
strategies, so that only those that we believe are most beneficial
are introduced in the restaurants. We continually review, and as
appropriate adjust, our mix of Company-operated and franchised
(conventional franchised, developmental licensed and foreign
affiliated) restaurants to help optimize overall performance.
The Company’s revenues consist of sales by Company-
operated restaurants and fees from restaurants operated by
franchisees. Revenues from conventional franchised restaurants
include rent and royalties based on a percent of sales along with
minimum rent payments, and initial fees. Revenues from restau-
rants licensed to affiliates and developmental licensees include a
royalty based on a percent of sales, and generally include initial
fees. Fees vary by type of site, amount of Company investment, if
any, and local business conditions. These fees, along with occu-
pancy and operating rights, are stipulated in franchise/license
agreements that generally have 20-year terms.
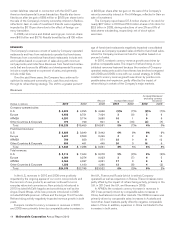
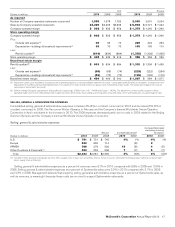
The business is managed as distinct geographic segments.
Significant reportable segments include the United States (U.S.),
Europe, and Asia/Pacific, Middle East and Africa (APMEA). In
addition, throughout this report we present “Other Countries &
Corporate” that includes operations in Canada and Latin America,
as well as Corporate activities. The U.S., Europe and APMEA
segments account for 34%, 40% and 21% of total revenues,
respectively. The United Kingdom (U.K.), France and Germany,
collectively, account for over 50% of Europe’s revenues; and
China, Australia and Japan (a 50%-owned affiliate accounted for
under the equity method), collectively, account for over 50% of
APMEA’s revenues. These six markets along with the U.S. and
Canada are referred to as “major markets” throughout this report
and comprise approximately 70% of total revenues.
The Company continues to focus its management and finan-
cial resources on the McDonald’s restaurant business as we
believe significant opportunities remain for long-term growth.
Accordingly, in 2009, the Company sold its minority ownership
interest in Redbox Automated Retail, LLC (Redbox) for total
consideration of $140 million. In 2008, the Company sold its
minority ownership interest in U.K.-based Pret A Manger for cash
proceeds of $229 million. In connection with both sales, the
Company recognized nonoperating gains.
In analyzing business trends, management considers a variety
of performance and financial measures, including comparable
sales and comparable guest count growth, Systemwide sales
growth and returns.
• Constant currency results exclude the effects of foreign cur-
rency translation and are calculated by translating current year
results at prior year average exchange rates. Management
reviews and analyzes business results in constant currencies
and bases certain incentive compensation plans on these
results because we believe this better represents the Compa-
ny’s underlying business trends.
• Comparable sales and comparable guest counts are key per-
formance indicators used within the retail industry and are
indicative of acceptance of the Company’s initiatives as well as
local economic and consumer trends. Increases or decreases
in comparable sales and comparable guest counts represent
the percent change in sales and transactions, respectively,
from the same period in the prior year for all restaurants in
operation at least thirteen months, including those temporarily
closed. Some of the reasons restaurants may be temporarily
closed include reimaging or remodeling, rebuilding, road con-
struction and natural disasters. Comparable sales exclude the
impact of currency translation. McDonald’s reports on a calen-
dar basis and therefore the comparability of the same month,
quarter and year with the corresponding period of the prior
year will be impacted by the mix of days. The number of week-
days and weekend days in a given timeframe can have a
positive or negative impact on comparable sales and guest
counts. The Company refers to these impacts as calendar
shift/trading day adjustments. In addition, the timing of holidays
can impact comparable sales and guest counts. These impacts
vary geographically due to consumer spending patterns and
have the greatest effect on monthly comparable sales and
guest counts while the annual impacts are typically minimal. In
2008, there was an incremental full day of sales and guest
counts due to leap year.
• Systemwide sales include sales at all restaurants, whether
operated by the Company or by franchisees. While franchised
sales are not recorded as revenues by the Company, manage-
ment believes the information is important in understanding the
Company’s financial performance because these sales are the
basis on which the Company calculates and records franchised
revenues and are indicative of the financial health of the fran-
chisee base.
McDonald’s Corporation Annual Report 2010 9