McDonalds 2010 Annual Report Download - page 18
Download and view the complete annual report
Please find page 18 of the 2010 McDonalds annual report below. You can navigate through the pages in the report by either clicking on the pages listed below, or by using the keyword search tool below to find specific information within the annual report.-
 1
1 -
2
-
3
-
4
-
5
-
6
-
7
-
 8
8 -
 9
9 -
 10
10 -
 11
11 -
 12
12 -
 13
13 -
 14
14 -
 15
15 -
 16
16 -
 17
17 -
 18
18 -
 19
19 -
 20
20 -
 21
21 -
 22
22 -
 23
23 -
 24
24 -
 25
25 -
 26
26 -
 27
27 -
 28
28 -
29
-
30
-
31
-
32
-
33
-
34
-
35
-
36
-
37
-
38
-
39
-
40
-
41
-
42
-
43
-
44
-
45
-
46
-
47
-
48
-
49
-
50
-
51
-
52
 |
 |

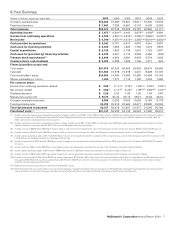
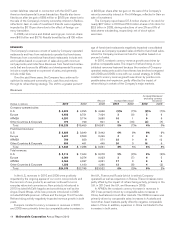
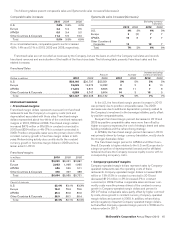
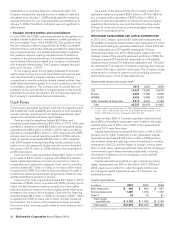
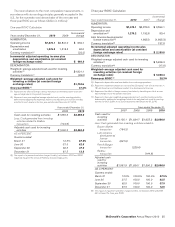
Company-operated margins
In millions 2010 2009 2008
U.S. $ 902 $ 832 $ 856
Europe 1,373 1,240 1,340
APMEA 764 624 584
Other Countries & Corporate 134 111 128
Total $3,173 $2,807 $2,908
Percent of sales
U.S. 21.3% 19.4% 18.5%
Europe 19.8 18.4 18.0
APMEA 17.8 16.8 15.9
Other Countries & Corporate 17.2 15.2 15.3
Total 19.6% 18.2% 17.6%
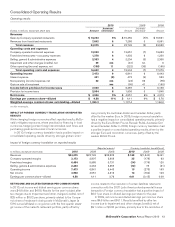
In the U.S., the Company-operated margin percent increased
in 2010 due to lower commodity costs and positive comparable
sales, partly offset by higher labor costs. The margin percent
increased in 2009 due to positive comparable sales, partly offset
by additional depreciation related to the beverage initiative and
higher commodity costs. Refranchising had a positive impact on
both periods.
Europe’s Company-operated margin percent increased in
2010 primarily due to positive comparable sales and lower
commodity costs, partly offset by higher labor costs. The margin
percent increased in 2009 primarily due to positive comparable
sales, partly offset by higher commodity and labor costs. In 2009,
local inflation and the impact of weaker currencies on the cost of
certain imported products drove higher costs, primarily in Russia,
and negatively impacted the Company-operated margin percent.
In APMEA, the Company-operated margin percent increased
in 2010 primarily due to positive comparable sales and lower
commodity costs, partly offset by higher occupancy & other costs
and increased labor costs. The margin percent increased in 2009
due to positive comparable sales, partly offset by higher labor
costs.
• Supplemental information regarding Company-
operated restaurants
We continually review our restaurant ownership mix with a goal of
improving local relevance, profits and returns. In most cases,
franchising is the best way to achieve these goals, but as pre-
viously stated, Company-operated restaurants are also important
to our success.
We report results for Company-operated restaurants based
on their sales, less costs directly incurred by that business includ-
ing occupancy costs. We report the results for franchised
restaurants based on franchised revenues, less associated occu-
pancy costs. For this reason and because we manage our
business based on geographic segments and not on the basis of
our ownership structure, we do not specifically allocate selling,
general & administrative expenses and other operating (income)
expenses to Company-operated or franchised restaurants. Other
operating items that relate to the Company-operated restaurants
generally include gains/losses on sales of restaurant businesses
and write-offs of equipment and leasehold improvements.
We believe the following information about Company-
operated restaurants in our most significant markets provides an
additional perspective on this business. Management responsible
for our Company-operated restaurants in these markets analyzes
the Company-operated business on this basis to assess its per-
formance. Management of the Company also considers this
information when evaluating restaurant ownership mix, subject to
other relevant considerations.
The following table seeks to illustrate the two components of
our Company-operated margins. The first of these relates
exclusively to restaurant operations, which we refer to as “Store
operating margin.” The second relates to the value of our brand
and the real estate interest we retain for which we charge rent
and royalties. We refer to this component as “Brand/real estate
margin.” Both Company-operated and conventional franchised
restaurants are charged rent and royalties, although rent and
royalties for Company-operated restaurants are eliminated in
consolidation. Rent and royalties for both restaurant ownership
types are based on a percentage of sales, and the actual rent
percentage varies depending on the level of McDonald’s invest-
ment in the restaurant. Royalty rates may also vary by market.
As shown in the following table, in disaggregating the compo-
nents of our Company-operated margins, certain costs
with respect to Company-operated restaurants are reflected in
Brand/real estate margin. Those costs consist of rent payable by
McDonald’s to third parties on leased sites and depreciation for
buildings and leasehold improvements and constitute a portion of
occupancy & other operating expenses recorded in the Con-
solidated statement of income. Store operating margins reflect
rent and royalty expenses, and those amounts are accounted for
as income in calculating Brand/real estate margin.
While we believe that the following information provides a
perspective in evaluating our Company-operated business, it is
not intended as a measure of our operating performance or as an
alternative to operating income or restaurant margins as reported
by the Company in accordance with accounting principles gen-
erally accepted in the U.S. In particular, as noted previously, we
do not allocate selling, general & administrative expenses to our
Company-operated business. However, we believe that a range
of $40,000 to $50,000 per restaurant, on average, is a typical
range of costs to support this business in the U.S. The actual
costs in markets outside the U.S. will vary depending on local
circumstances and the organizational structure of the market.
These costs reflect the indirect services we believe are neces-
sary to provide the appropriate support of the restaurant.
16 McDonald’s Corporation Annual Report 2010