McDonalds 2010 Annual Report Download - page 15
Download and view the complete annual report
Please find page 15 of the 2010 McDonalds annual report below. You can navigate through the pages in the report by either clicking on the pages listed below, or by using the keyword search tool below to find specific information within the annual report.-
 1
1 -
2
-
3
-
4
-
 5
5 -
 6
6 -
 7
7 -
 8
8 -
 9
9 -
 10
10 -
 11
11 -
 12
12 -
 13
13 -
 14
14 -
 15
15 -
 16
16 -
 17
17 -
 18
18 -
 19
19 -
 20
20 -
 21
21 -
 22
22 -
 23
23 -
 24
24 -
 25
25 -
26
-
27
-
28
-
29
-
30
-
31
-
32
-
33
-
34
-
35
-
36
-
37
-
38
-
39
-
40
-
41
-
42
-
43
-
44
-
45
-
46
-
47
-
48
-
49
-
50
-
51
-
52
 |
 |

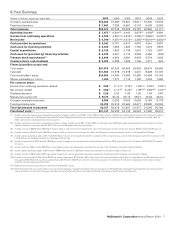
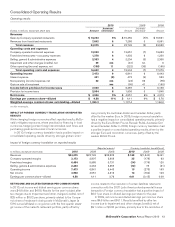
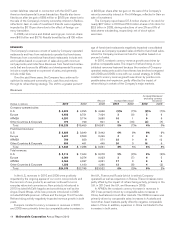
Consolidated Operating Results
Operating results
2010 2009 2008
Dollars in millions, except per share data Amount
Increase/
(decrease) Amount Increase/
(decrease) Amount
Revenues
Sales by Company-operated restaurants $ 16,233 5% $ 15,459 (7)% $ 16,561
Revenues from franchised restaurants 7,842 8 7,286 5 6,961
Total revenues 24,075 6 22,745 (3) 23,522
Operating costs and expenses
Company-operated restaurant expenses 13,060 3 12,651 (7) 13,653
Franchised restaurants—occupancy expenses 1,378 6 1,302 6 1,230
Selling, general & administrative expenses 2,333 4 2,234 (5) 2,355
Impairment and other charges (credits), net 29 nm (61) nm 6
Other operating (income) expense, net (198) 11 (222) (35) (165)
Total operating costs and expenses 16,602 4 15,904 (7) 17,079
Operating income 7,473 9 6,841 6 6,443
Interest expense 451 (5) 473 (9) 523
Nonoperating (income) expense, net 22 nm (24) 69 (78)
Gain on sale of investment nm (95) 41 (160)
Income before provision for income taxes 7,000 8 6,487 5 6,158
Provision for income taxes 2,054 6 1,936 5 1,845
Net income $ 4,946 9% $ 4,551 6% $ 4,313
Earnings per common share—diluted $ 4.58 11% $ 4.11 9% $ 3.76
Weighted-average common shares outstanding—diluted 1,080.3 1,107.4 1,146.0
nm Not meaningful.
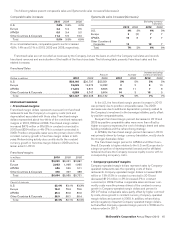
IMPACT OF FOREIGN CURRENCY TRANSLATION ON REPORTED
RESULTS
While changing foreign currencies affect reported results, McDo-
nald’s mitigates exposures, where practical, by financing in local
currencies, hedging certain foreign-denominated cash flows, and
purchasing goods and services in local currencies.
In 2010, foreign currency translation had a positive impact on
consolidated operating results driven by stronger global curren-
cies, primarily the Australian Dollar and Canadian Dollar, partly
offset by the weaker Euro. In 2009, foreign currency translation
had a negative impact on consolidated operating results, primarily
driven by the Euro, British Pound, Russian Ruble, Australian Dol-
lar and Canadian Dollar. In 2008, foreign currency translation had
a positive impact on consolidated operating results, driven by the
stronger Euro and most other currencies, partly offset by the
weaker British Pound.
Impact of foreign currency translation on reported results
Reported amount Currency translation benefit/(cost)
In millions, except per share data 2010 2009 2008 2010 2009 2008
Revenues $24,075 $22,745 $23,522 $ 188 $(1,340) $ 441
Company-operated margins 3,173 2,807 2,908 35 (178) 63
Franchised margins 6,464 5,985 5,731 (14) (176) 120
Selling, general & administrative expenses 2,333 2,234 2,355 (12) 75 (21)
Operating income 7,473 6,841 6,443 13 (273) 163
Net income 4,946 4,551 4,313 13 (164) 103
Earnings per common share—diluted 4.58 4.11 3.76 0.01 (0.15) 0.09
NET INCOME AND DILUTED EARNINGS PER COMMON SHARE
In 2010, net income and diluted earnings per common share
were $4.9 billion and $4.58. Results for the year included after
tax charges due to Impairment and other charges (credits), net of
$25 million or $0.02 per share, primarily related to the Compa-
ny’s share of restaurant closing costs in McDonald’s Japan (a
50%-owned affiliate) in conjunction with the first quarter strate-
gic review of the market’s restaurant portfolio, partly offset by
income related to the resolution of certain liabilities retained in
connection with the 2007 Latin America developmental license
transaction. Foreign currency translation had a positive impact of
$0.01 per share on diluted earnings per share for the year.
In 2009, net income and diluted earnings per common share
were $4.6 billion and $4.11. Results benefited by after tax
income due to Impairment and other charges (credits), net of
$91 million or $0.08 per share, primarily due to the resolution of
McDonald’s Corporation Annual Report 2010 13