McDonalds 2010 Annual Report Download - page 9
Download and view the complete annual report
Please find page 9 of the 2010 McDonalds annual report below. You can navigate through the pages in the report by either clicking on the pages listed below, or by using the keyword search tool below to find specific information within the annual report.-
 1
1 -
 2
2 -
 3
3 -
 4
4 -
 5
5 -
 6
6 -
 7
7 -
 8
8 -
 9
9 -
 10
10 -
 11
11 -
 12
12 -
 13
13 -
 14
14 -
 15
15 -
 16
16 -
 17
17 -
 18
18 -
 19
19 -
 20
20 -
21
-
22
-
23
-
24
-
25
-
26
-
27
-
28
-
29
-
30
-
31
-
32
-
33
-
34
-
35
-
36
-
37
-
38
-
39
-
40
-
41
-
42
-
43
-
44
-
45
-
46
-
47
-
48
-
49
-
50
-
51
-
52
 |
 |

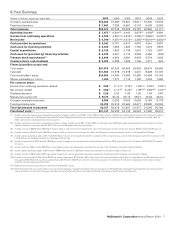
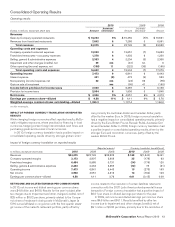
6-Year Summary
Dollars in millions, except per share data 2010 2009 2008 2007 2006 2005
Company-operated sales $16,233 15,459 16,561 16,611 15,402 14,018
Franchised revenues $ 7,842 7,286 6,961 6,176 5,493 5,099
Total revenues $24,075 22,745 23,522 22,787 20,895 19,117
Operating income $ 7,473(1) 6,841(2) 6,443 3,879(5) 4,433(8) 3,984
Income from continuing operations $ 4,946(1) 4,551(2,3) 4,313(4) 2,335(5,6) 2,866(8) 2,578(10)
Net income $ 4,946(1) 4,551(2,3) 4,313(4) 2,395(5,6,7)
3,544(8,9) 2,602(10)
Cash provided by operations $ 6,342 5,751 5,917 4,876 4,341 4,337
Cash used for investing activities $ 2,056 1,655 1,625 1,150 1,274 1,818
Capital expenditures $ 2,136 1,952 2,136 1,947 1,742 1,607
Cash used for (provided by) financing activities $ 3,729 4,421 4,115 3,996 5,460 (442)
Treasury stock repurchased(11) $ 2,648 2,854 3,981 3,949 3,719 1,228
Common stock cash dividends $ 2,408 2,235 1,823 1,766 1,217 842
Financial position at year end:
Total assets $31,975 30,225 28,462 29,392 28,974 29,989
Total debt $11,505 10,578 10,218 9,301 8,408 10,137
Total shareholders’ equity $14,634 14,034 13,383 15,280 15,458 15,146
Shares outstanding in millions 1,054 1,077 1,115 1,165 1,204 1,263
Per common share:
Income from continuing operations–diluted $ 4.58(1) 4.11(2,3) 3.76(4) 1.93(5,6) 2.29(8) 2.02(10)
Net income–diluted $ 4.58(1) 4.11(2,3) 3.76(4) 1.98(5,6,7) 2.83(8,9) 2.04(10)
Dividends declared $ 2.26 2.05 1.63 1.50 1.00 0.67
Market price at year end $ 76.76 62.44 62.19 58.91 44.33 33.72
Company-operated restaurants 6,399 6,262 6,502 6,906 8,166 8,173
Franchised restaurants 26,338 26,216 25,465 24,471 22,880 22,593
Total Systemwide restaurants 32,737 32,478 31,967 31,377 31,046 30,766
Franchised sales(12) $61,147 56,928 54,132 46,943 41,380 38,913
(1) Includes net pretax expense due to Impairment and other charges (credits), net of $29.1 million ($24.6 million after tax or $0.02 per share) primarily related to the Company’s share of
restaurant closing costs in McDonald’s Japan (a 50%-owned affiliate) partially offset by income primarily related to the resolution of certain liabilities retained in connection with the
2007 Latin America developmental license transaction.
(2) Includes net pretax income due to Impairment and other charges (credits), net of $61.1 million ($91.4 million after tax or $0.08 per share) primarily related to the resolution of certain
liabilities retained in connection with the 2007 Latin America developmental license transaction.
(3) Includes income of $58.8 million ($0.05 per share) in Gain on sale of investment related to the sale of the Company’s minority ownership interest in Redbox Automated Retail, LLC.
(4) Includes income of $109.0 million ($0.09 per share) in Gain on sale of investment from the sale of the Company’s minority ownership interest in U.K.-based Pret A Manger.
(5) Includes pretax operating charges of $1.7 billion ($1.32 per share) due to Impairment and other charges (credits), net primarily as a result of the Company’s sale of its businesses in 18
Latin American and Caribbean markets to a developmental licensee.
(6) Includes a tax benefit of $316.4 million ($0.26 per share) resulting from the completion of an Internal Revenue Service (IRS) examination of the Company’s 2003-2004 U.S. federal
tax returns.
(7) Includes income of $60.1 million ($0.05 per share) related to discontinued operations primarily from the sale of the Company’s investment in Boston Market.
(8) Includes pretax operating charges of $134 million ($98 million after tax or $0.08 per share) due to Impairment and other charges (credits), net.
(9) Includes income of $678 million ($0.54 per share) related to discontinued operations primarily resulting from the disposal of the Company’s investment in Chipotle.
(10) Includes a net tax benefit of $73 million ($0.05 per share) comprised of $179 million ($0.14 per share) of income tax benefit resulting from the completion of an IRS examination of the
Company’s 2000-2002 U.S. tax returns, partly offset by $106 million ($0.09 per share) of incremental tax expense resulting from the decision to repatriate certain foreign earnings
under the Homeland Investment Act (HIA).
(11) Represents treasury stock purchases as reflected in Shareholders’ equity.
(12) While franchised sales are not recorded as revenues by the Company, management believes they are important in understanding the Company’s financial performance because these
sales are the basis on which the Company calculates and records franchised revenues and are indicative of the financial health of the franchisee base.
McDonald’s Corporation Annual Report 2010 7