McDonalds 2010 Annual Report Download - page 22
Download and view the complete annual report
Please find page 22 of the 2010 McDonalds annual report below. You can navigate through the pages in the report by either clicking on the pages listed below, or by using the keyword search tool below to find specific information within the annual report.-
 1
1 -
2
-
3
-
4
-
5
-
6
-
7
-
8
-
9
-
10
-
11
-
 12
12 -
 13
13 -
 14
14 -
 15
15 -
 16
16 -
 17
17 -
 18
18 -
 19
19 -
 20
20 -
 21
21 -
 22
22 -
 23
23 -
 24
24 -
 25
25 -
 26
26 -
 27
27 -
 28
28 -
 29
29 -
 30
30 -
 31
31 -
 32
32 -
33
-
34
-
35
-
36
-
37
-
38
-
39
-
40
-
41
-
42
-
43
-
44
-
45
-
46
-
47
-
48
-
49
-
50
-
51
-
52
 |
 |

statements on a recurring basis (i.e., at least annually). The
Company adopted the required provisions related to debt and
derivatives as of January 1, 2008 and adopted the remaining
required provisions for non-financial assets and liabilities as of
January 1, 2009. The effect of adoption was not significant in
either period.
• Variable interest entities and consolidation
In June 2009, the FASB issued amendments to the guidance on
variable interest entities and consolidation, codified primarily in
the Consolidation Topic of the FASB ASC. This guidance modi-
fies the method for determining whether an entity is a variable
interest entity as well as the methods permitted for determining
the primary beneficiary of a variable interest entity. In addition,
this guidance requires ongoing reassessments of whether a
company is the primary beneficiary of a variable interest entity
and enhanced disclosures related to a company’s involvement
with a variable interest entity. The Company adopted this guid-
ance as of January 1, 2010.
On an ongoing basis, the Company evaluates its business
relationships such as those with franchisees, joint venture part-
ners, developmental licensees, suppliers, and advertising
cooperatives to identify potential variable interest entities. Gen-
erally, these businesses qualify for a scope exception under the
consolidation guidance. The Company has concluded that con-
solidation of any such entities is not appropriate for the periods
presented. As a result, the adoption did not have any impact on
the Company’s consolidated financial statements.
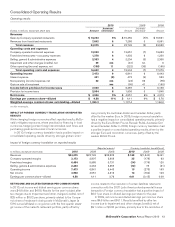
Cash Flows
The Company generates significant cash from its operations and
has substantial credit availability and capacity to fund operating
and discretionary spending such as capital expenditures, debt
repayments, dividends and share repurchases.
Cash provided by operations totaled $6.3 billion and
exceeded capital expenditures by $4.2 billion in 2010, while cash
provided by operations totaled $5.8 billion and exceeded capital
expenditures by $3.8 billion in 2009. In 2010, cash provided by
operations increased $591 million or 10% compared with 2009
primarily due to increased operating results. In 2009, cash pro-
vided by operations decreased $166 million or 3% compared
with 2008 despite increased operating results, primarily due to
higher income tax payments, higher noncash income items and
the receipt of $143 million in 2008 related to the completion of
an IRS examination.
Cash used for investing activities totaled $2.1 billion in 2010,
an increase of $401 million compared with 2009. This reflects
higher capital expenditures and lower proceeds from sales of
investments and restaurant businesses. Cash used for investing
activities totaled $1.7 billion in 2009, an increase of $31 million
compared with 2008. This reflects lower proceeds from sales of
investments, restaurant businesses and property, offset by lower
capital expenditures, primarily in the U.S.
Cash used for financing activities totaled $3.7 billion in 2010,
a decrease of $692 million compared with 2009, primarily due to
higher net debt issuances, higher proceeds from stock option
exercises and lower treasury stock purchases, partly offset by an
increase in the common stock dividend. Cash used for financing
activities totaled $4.4 billion in 2009, an increase of $307 million
compared with 2008, primarily due to lower net debt issuances,
an increase in the common stock dividend and lower proceeds
from stock option exercises, partly offset by lower treasury stock
purchases.
As a result of the above activity, the Company’s cash and
equivalents balance increased $591 million in 2010 to $2.4 bil-
lion, compared with a decrease of $267 million in 2009. In
addition to cash and equivalents on hand and cash provided by
operations, the Company can meet short-term funding needs
through its continued access to commercial paper borrowings
and line of credit agreements.
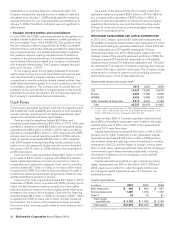
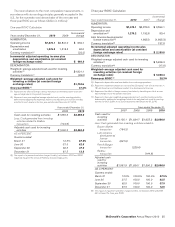
RESTAURANT DEVELOPMENT AND CAPITAL EXPENDITURES
In 2010, the Company opened 957 traditional restaurants and
35 satellite restaurants (small, limited-menu restaurants for which
the land and building are generally leased), and closed 406 tradi-
tional restaurants and 327 satellite restaurants. Of these
closures, there were over 400 in McDonald’s Japan due to the
strategic review of the market’s restaurant portfolio. In 2009, the
Company opened 824 traditional restaurants and 44 satellite
restaurants and closed 215 traditional restaurants and 142 satel-
lite restaurants. The majority of restaurant openings and closings
occurred in the major markets in both years. The Company closes
restaurants for a variety of reasons, such as existing sales and
profit performance or loss of real estate tenure.
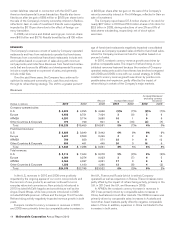
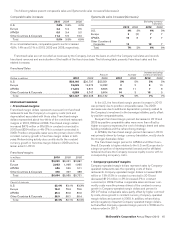
Systemwide restaurants at year end(1)
2010 2009 2008
U.S. 14,027 13,980 13,918
Europe 6,969 6,785 6,628
APMEA 8,424 8,488 8,255
Other Countries & Corporate 3,317 3,225 3,166
Total 32,737 32,478 31,967
(1) Includes satellite units at December 31, 2010, 2009 and 2008 as follows: U.S. –
1,112, 1,155, 1,169; Europe–239, 241, 226; APMEA (primarily Japan)–1,010,
1,263, 1,379; Other Countries & Corporate–470, 464, 447.
Approximately 65% of Company-operated restaurants and
about 80% of franchised restaurants were located in the major
markets at the end of 2010. About 80% of the restaurants at
year-end 2010 were franchised.
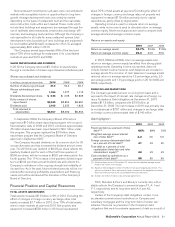
Capital expenditures increased $183 million or 9% in 2010
primarily due to higher investment in new restaurants. Capital
expenditures decreased $184 million or 9% in 2009 primarily
due to fewer restaurant openings, lower reinvestment in existing
restaurants in the U.S. and the impact of foreign currency trans-
lation. In both years, capital expenditures reflected the Company’s
commitment to grow sales at existing restaurants, including
reinvestment initiatives such as reimaging in many markets
around the world.
Capital expenditures invested in major markets, excluding
Japan, represented over 65% of the total in 2010, 2009 and
2008. Japan is accounted for under the equity method, and
accordingly its capital expenditures are not included in con-
solidated amounts.
Capital expenditures
In millions 2010 2009 2008
New restaurants $ 968 $ 809 $ 897
Existing restaurants 1,089 1,070 1,152
Other(1) 78 73 87
Total capital
expenditures $ 2,135 $ 1,952 $ 2,136
Total assets $31,975 $30,225 $28,462
(1) Primarily corporate equipment and other office-related expenditures.
20 McDonald’s Corporation Annual Report 2010