McDonalds 2010 Annual Report Download - page 44
Download and view the complete annual report
Please find page 44 of the 2010 McDonalds annual report below. You can navigate through the pages in the report by either clicking on the pages listed below, or by using the keyword search tool below to find specific information within the annual report.-
 1
1 -
2
-
3
-
4
-
5
-
6
-
7
-
8
-
9
-
10
-
11
-
12
-
13
-
14
-
15
-
16
-
17
-
18
-
19
-
20
-
21
-
22
-
23
-
24
-
25
-
26
-
27
-
28
-
29
-
30
-
31
-
32
-
33
-
 34
34 -
 35
35 -
 36
36 -
 37
37 -
 38
38 -
 39
39 -
 40
40 -
 41
41 -
 42
42 -
 43
43 -
 44
44 -
 45
45 -
 46
46 -
 47
47 -
 48
48 -
 49
49 -
 50
50 -
 51
51 -
 52
52
 |
 |

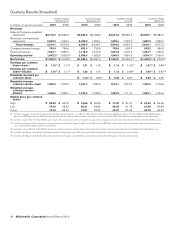
Quarterly Results (Unaudited)
Quarters ended
December 31 Quarters ended
September 30 Quarters ended
June 30 Quarters ended
March 31
In millions, except per share data 2010 2009 2010 2009 2010 2009 2010 2009
Revenues
Sales by Company-operated
restaurants $4,170.2 $4,030.0 $4,246.6 $4,093.6 $4,013.4 $3,850.2 $3,803.1 $3,484.7
Revenues from franchised
restaurants 2,043.9 1,943.4 2,058.3 1,953.1 1,932.1 1,797.0 1,807.0 1,592.7
Total revenues 6,214.1 5,973.4 6,304.9 6,046.7 5,945.5 5,647.2 5,610.1 5,077.4
Company-operated margin 790.4 758.4 892.6 793.8 798.6 690.9 692.2 564.2
Franchised margin 1,684.1 1,595.0 1,713.9 1,614.5 1,597.8 1,479.0 1,467.7 1,296.0
Operating income 1,857.2(1) 1,826.3(1) 2,096.5 1,932.8 1,845.3 1,681.5 1,674.1(3) 1,400.4
Net income $1,242.3(1) $1,216.8(1) $1,388.4 $1,261.0 $1,225.8 $1,093.7(2) $1,089.8(3) $ 979.5(4)
Earnings per common
share—basic: $ 1.18(1) $ 1.13(1) $ 1.31 $ 1.16 $ 1.14 $ 1.00(2) $ 1.01(3) $ 0.88(4)
Earnings per common
share—diluted: $ 1.16(1) $ 1.11(1) $ 1.29 $ 1.15 $ 1.13 $ 0.98(2) $ 1.00(3) $ 0.87(4)
Dividends declared per
common share $ 1.16(5) $ 1.05(6) $ 0.55 $ 0.50 $ 0.55 $ 0.50
Weighted-average
common shares—basic 1,055.0 1,078.0 1,061.0 1,084.5 1,072.1 1,097.3 1,076.0 1,109.6
Weighted-average
common shares—
diluted 1,068.8 1,093.1 1,074.9 1,098.2 1,085.9 1,111.4 1,090.1 1,124.4
Market price per common
share:
High $ 80.94 $ 64.75 $ 76.26 $ 59.59 $ 71.84 $ 61.01 $ 67.49 $ 64.46
Low 74.40 56.03 65.31 53.88 65.55 51.76 61.06 50.44
Close 76.76 62.44 74.51 57.07 65.87 57.49 66.72 54.57
(1) Includes net pretax income due to Impairment and other charges (credits), net of $12.1 million ($14.4 million after tax or $0.01 per share) in 2010 and $62.0 million ($89.6 million
after tax or $0.08 per share) in 2009 primarily related to the resolution of certain liabilities retained in connection with the 2007 Latin America developmental license transaction.
(2) Includes income of $11.1 million ($0.01 per share) in Gain on sale of investment related to the sale of the Company’s minority ownership interest in Redbox Automated Retail, LLC.
(3) Includes net pretax and after tax expense due to Impairment and other charges (credits), net of $30.0 million ($0.03 per share) related to the Company’s share of restaurant closing
costs in McDonald’s Japan (a 50%-owned affiliate).
(4) Includes income of $47.4 million ($0.04 per share) in Gain on sale of investment due to the sale of the Company’s minority ownership interest in Redbox Automated Retail, LLC.
(5) Includes a $0.55 per share dividend declared and paid in third quarter and a $0.61 per share dividend declared in third quarter and paid in fourth quarter.
(6) Includes a $0.50 per share dividend declared and paid in third quarter and a $0.55 per share dividend declared in third quarter and paid in fourth quarter.
42 McDonald’s Corporation Annual Report 2010