McDonalds 2010 Annual Report Download - page 19
Download and view the complete annual report
Please find page 19 of the 2010 McDonalds annual report below. You can navigate through the pages in the report by either clicking on the pages listed below, or by using the keyword search tool below to find specific information within the annual report.-
 1
1 -
2
-
3
-
4
-
5
-
6
-
7
-
8
-
 9
9 -
 10
10 -
 11
11 -
 12
12 -
 13
13 -
 14
14 -
 15
15 -
 16
16 -
 17
17 -
 18
18 -
 19
19 -
 20
20 -
 21
21 -
 22
22 -
 23
23 -
 24
24 -
 25
25 -
 26
26 -
 27
27 -
 28
28 -
 29
29 -
30
-
31
-
32
-
33
-
34
-
35
-
36
-
37
-
38
-
39
-
40
-
41
-
42
-
43
-
44
-
45
-
46
-
47
-
48
-
49
-
50
-
51
-
52
 |
 |

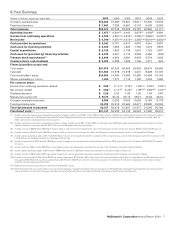
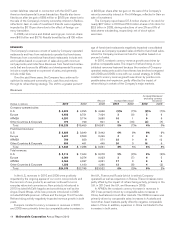
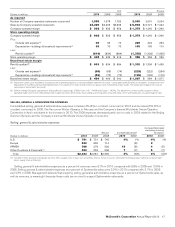
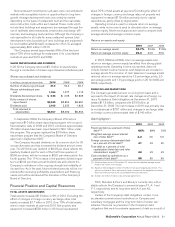
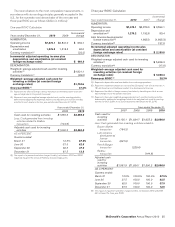
U.S. Europe
Dollars in millions 2010 2009 2008 2010 2009 2008
As reported
Number of Company-operated restaurants at year end 1,550 1,578 1,782 2,005 2,001 2,024
Sales by Company-operated restaurants $4,229 $4,295 $4,636 $ 6,932 $ 6,721 $ 7,424
Company-operated margin $ 902 $ 832 $ 856 $ 1,373 $ 1,240 $ 1,340
Store operating margin
Company-operated margin $ 902 $ 832 $ 856 $ 1,373 $ 1,240 $ 1,340
Plus:
Outside rent expense(1) 60 65 74 223 222 254
Depreciation—buildings & leasehold improvements(1) 65 70 70 105 100 110
Less:
Rent & royalties(2) (619) (634) (684) (1,335) (1,306) (1,435)
Store operating margin $ 408 $ 333 $ 316 $ 366 $ 256 $ 269
Brand/real estate margin
Rent & royalties(2) $ 619 $ 634 $ 684 $ 1,335 $ 1,306 $ 1,435
Less:
Outside rent expense(1) (60) (65) (74) (223) (222) (254)
Depreciation—buildings & leasehold improvements(1) (65) (70) (70) (105) (100) (110)
Brand/real estate margin $ 494 $ 499 $ 540 $ 1,007 $ 984 $ 1,071
(1) Represents certain costs recorded as occupancy & other operating expenses in the Consolidated statement of income – rent payable by McDonald’s to third parties on leased sites and
depreciation for buildings and leasehold improvements. This adjustment is made to reflect these occupancy costs in Brand/real estate margin. The relative percentage of sites that are
owned versus leased varies by country.
(2) Reflects average Company–operated rent and royalties (as a percentage of 2010 sales: U.S. – 14.6% and Europe – 19.3%). This adjustment is made to reflect expense in Store
operating margin and income in Brand/real estate margin. Countries within Europe have varying economic profiles and a wide range of rent and royalty rates as a percentage of sales.
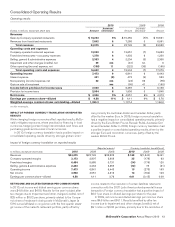
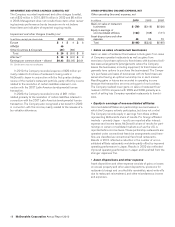
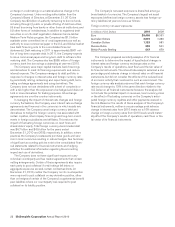
SELLING, GENERAL & ADMINISTRATIVE EXPENSES
Consolidated selling, general & administrative expenses increased 4% (4% in constant currencies) in 2010 and decreased 5% (2% in
constant currencies) in 2009. The Vancouver Winter Olympics in February and the Company’s biennial Worldwide Owner/Operator
Convention in April contributed to the increase in 2010. The 2009 expenses decreased partly due to costs in 2008 related to the Beijing
Summer Olympics and the Company’s biennial Worldwide Owner/Operator Convention.
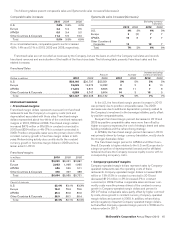
Selling, general & administrative expenses
Amount Increase/(decrease)
Increase/(decrease)
excluding currency
translation
Dollars in millions 2010 2009 2008 2010 2009 2010 2009
U.S. $ 781 $ 751 $ 745 4% 1% 4% 1%
Europe 653 655 714 (8) 2
APMEA 306 276 300 10 (8) 4(5)
Other Countries & Corporate(1) 593 552 596 7(7) 5(7)
Total $2,333 $2,234 $2,355 4% (5)% 4% (2)%
(1) Included in Other Countries & Corporate are home office support costs in areas such as facilities, finance, human resources, information technology, legal, marketing, restaurant oper-
ations, supply chain and training.
Selling, general & administrative expenses as a percent of revenues were 9.7% in 2010 compared with 9.8% in 2009 and 10.0% in
2008. Selling, general & administrative expenses as a percent of Systemwide sales were 3.0% in 2010 compared with 3.1% in 2009
and 3.3% in 2008. Management believes that analyzing selling, general & administrative expenses as a percent of Systemwide sales, as
well as revenues, is meaningful because these costs are incurred to support Systemwide restaurants.
McDonald’s Corporation Annual Report 2010 17