McDonalds 2010 Annual Report Download - page 17
Download and view the complete annual report
Please find page 17 of the 2010 McDonalds annual report below. You can navigate through the pages in the report by either clicking on the pages listed below, or by using the keyword search tool below to find specific information within the annual report.-
 1
1 -
2
-
3
-
4
-
5
-
6
-
 7
7 -
 8
8 -
 9
9 -
 10
10 -
 11
11 -
 12
12 -
 13
13 -
 14
14 -
 15
15 -
 16
16 -
 17
17 -
 18
18 -
 19
19 -
 20
20 -
 21
21 -
 22
22 -
 23
23 -
 24
24 -
 25
25 -
 26
26 -
 27
27 -
28
-
29
-
30
-
31
-
32
-
33
-
34
-
35
-
36
-
37
-
38
-
39
-
40
-
41
-
42
-
43
-
44
-
45
-
46
-
47
-
48
-
49
-
50
-
51
-
52
 |
 |

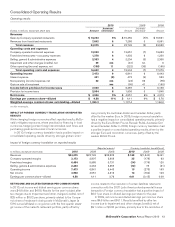
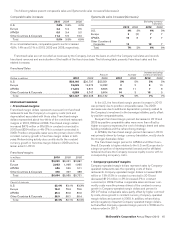
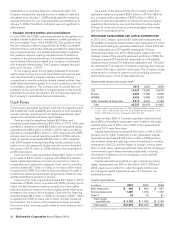
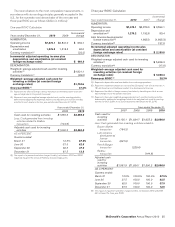
The following tables present comparable sales and Systemwide sales increases/(decreases):
Comparable sales increases
2010 2009 2008
U.S. 3.8% 2.6% 4.0%
Europe 4.4 5.2 8.5
APMEA 6.0 3.4 9.0
Other Countries & Corporate 11.3 5.5 13.0
Total 5.0% 3.8% 6.9%
On a consolidated basis, comparable guest counts increased
4.9%, 1.4% and 3.1% in 2010, 2009 and 2008, respectively.
Systemwide sales increases/(decreases)
Excluding currency
translation
2010 2009 2010 2009
U.S. 4% 3% 4% 3%
Europe 3(2) 77
APMEA 15 877
Other Countries &
Corporate 13 13 7
Total 7% 2% 6% 6%
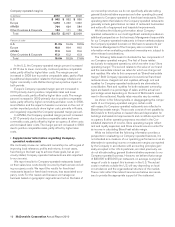
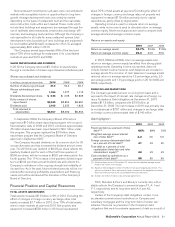
Franchised sales are not recorded as revenues by the Company, but are the basis on which the Company calculates and records
franchised revenues and are indicative of the health of the franchisee base. The following table presents Franchised sales and the
related increases:
Franchised Sales
Amount Increase Increase excluding
currency translation
Dollars in millions 2010 2009 2008 2010 2009 2010 2009
U.S. $28,166 $26,737 $25,351 5% 5% 5% 5%
Europe 15,049 14,573 14,282 32810
APMEA 11,373 9,871 8,895 15 11 78
Other Countries & Corporate 6,559 5,747 5,604 14 315 9
Total $61,147 $56,928 $54,132 7% 5% 7% 7%
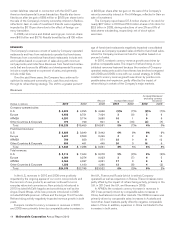
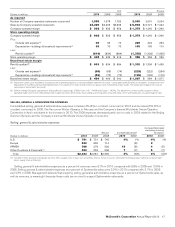
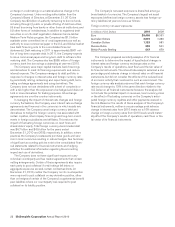
RESTAURANT MARGINS
• Franchised margins
Franchised margin dollars represent revenues from franchised
restaurants less the Company’s occupancy costs (rent and
depreciation) associated with those sites. Franchised margin
dollars represented about two-thirds of the combined restaurant
margins in 2010, 2009 and 2008. Franchised margin dollars
increased $479 million or 8% (8% in constant currencies) in
2010 and $254 million or 4% (7% in constant currencies) in
2009. Positive comparable sales were the primary driver of the
constant currency growth in franchise margin dollars in both
years. Refranchising activity also contributed to the constant
currency growth in franchise margin dollars in 2009 and to a
lesser extent in 2010.
Franchised margins
In millions 2010 2009 2008
U.S. $3,239 $3,031 $2,867
Europe 2,063 1,998 1,965
APMEA 686 559 511
Other Countries & Corporate 476 397 388
Total $6,464 $5,985 $5,731
Percent of revenues
U.S. 83.4% 83.1% 83.3%
Europe 78.2 78.3 78.6
APMEA 89.3 89.6 89.6
Other Countries & Corporate 86.0 86.1 86.4
Total 82.4% 82.1% 82.3%
In the U.S., the franchised margin percent increase in 2010
was primarily due to positive comparable sales. The 2009
decrease was due to additional depreciation primarily related to
the Company’s investment in the beverage initiative, partly offset
by positive comparable sales.
Europe’s franchised margin percent decreased in 2010 and
2009 as positive comparable sales were more than offset by
higher occupancy expenses, the cost of strategic brand and sales
building initiatives and the refranchising strategy.
In APMEA, the franchised margin percent decrease in 2010
was primarily driven by foreign currency translation, mostly due to
the stronger Australian dollar.
The franchised margin percent in APMEA and Other Coun-
tries & Corporate is higher relative to the U.S. and Europe due to
a larger proportion of developmental licensed and/or affiliated
restaurants where the Company receives royalty income with no
corresponding occupancy costs.
• Company-operated margins
Company-operated margin dollars represent sales by Company-
operated restaurants less the operating costs of these
restaurants. Company-operated margin dollars increased $366
million or 13% (12% in constant currencies) in 2010 and
decreased $101 million or 3% (increased 3% in constant
currencies) in 2009. Positive comparable sales and lower com-
modity costs were the primary drivers of the constant currency
growth in Company-operated margin dollars and percent in
2010. Positive comparable sales, partly offset by higher commod-
ity costs, drove growth in constant currency Company-operated
margin dollars and percent in 2009. In addition, refranchising
activity negatively impacted Company-operated margin dollars,
but benefited Company-operated margin percent in 2009 and to
a lesser extent in 2010.
McDonald’s Corporation Annual Report 2010 15