McDonalds 2010 Annual Report Download - page 16
Download and view the complete annual report
Please find page 16 of the 2010 McDonalds annual report below. You can navigate through the pages in the report by either clicking on the pages listed below, or by using the keyword search tool below to find specific information within the annual report.-
 1
1 -
2
-
3
-
4
-
5
-
 6
6 -
 7
7 -
 8
8 -
 9
9 -
 10
10 -
 11
11 -
 12
12 -
 13
13 -
 14
14 -
 15
15 -
 16
16 -
 17
17 -
 18
18 -
 19
19 -
 20
20 -
 21
21 -
 22
22 -
 23
23 -
 24
24 -
 25
25 -
 26
26 -
27
-
28
-
29
-
30
-
31
-
32
-
33
-
34
-
35
-
36
-
37
-
38
-
39
-
40
-
41
-
42
-
43
-
44
-
45
-
46
-
47
-
48
-
49
-
50
-
51
-
52
 |
 |

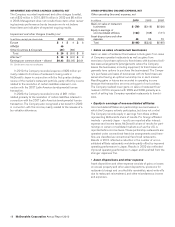
certain liabilities retained in connection with the 2007 Latin
America developmental license transaction. Results also bene-
fited by an after tax gain of $59 million or $0.05 per share due to
the sale of the Company’s minority ownership interest in Redbox,
reflected in Gain on sale of investment. Results were negatively
impacted by $0.15 per share due to the effect of foreign cur-
rency translation.
In 2008, net income and diluted earnings per common share
were $4.3 billion and $3.76. Results benefited by a $109 million
or $0.09 per share after tax gain on the sale of the Company’s
minority ownership interest in Pret A Manger, reflected in Gain on
sale of investment.
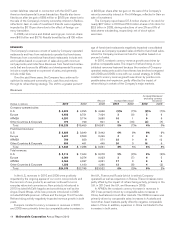
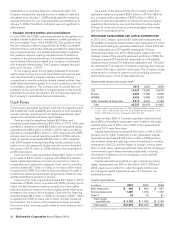
The Company repurchased 37.8 million shares of its stock for
nearly $2.7 billion in 2010 and 50.3 million shares of its stock for
$2.9 billion in 2009, driving reductions of over 2% and 3% of
total shares outstanding, respectively, net of stock option
exercises.
REVENUES
The Company’s revenues consist of sales by Company-operated
restaurants and fees from restaurants operated by franchisees.
Revenues from conventional franchised restaurants include rent
and royalties based on a percent of sales along with minimum
rent payments, and initial fees. Revenues from franchised restau-
rants that are licensed to affiliates and developmental licensees
include a royalty based on a percent of sales, and generally
include initial fees.
Over the past three years, the Company has continued to
optimize its restaurant ownership mix, cash flow and returns
through its refranchising strategy. The shift to a greater percent-
age of franchised restaurants negatively impacted consolidated
revenues as Company-operated sales shifted to franchised sales,
where the Company receives rent and/or royalties based on a
percent of sales.
In 2010, constant currency revenue growth was driven by
positive comparable sales. The impact of refranchising on con-
solidated revenues lessened because the number of Company-
operated restaurants sold to franchisees has declined compared
with 2009 and 2008, in line with our overall strategy. In 2009,
constant currency revenue growth was driven by positive com-
parable sales and expansion, partly offset by the impact of
refranchising in certain of the Company’s major markets.
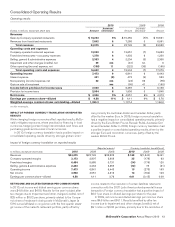
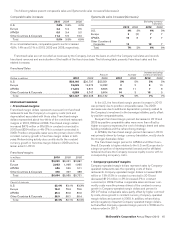
Revenues
Amount Increase/(decrease)
Increase/(decrease)
excluding currency
translation
Dollars in millions 2010 2009 2008 2010 2009 2010 2009
Company-operated sales:
U.S. $ 4,229 $ 4,295 $ 4,636 (2)% (7)% (2)% (7)%
Europe 6,932 6,721 7,424 3(9) 53
APMEA 4,297 3,714 3,660 16 195
Other Countries & Corporate 775 729 841 6(13) (3) (7)
Total $16,233 $15,459 $16,561 5% (7)% 4% 0%
Franchised revenues:
U.S. $ 3,883 $ 3,649 $ 3,442 6% 6% 6% 6%
Europe 2,637 2,553 2,499 32810
APMEA 769 623 571 23 911 12
Other Countries & Corporate 553 461 449 20 316 9
Total $ 7,842 $ 7,286 $ 6,961 8% 5% 8% 8%
Total revenues:
U.S. $ 8,112 $ 7,944 $ 8,078 2% (2)% 2% (2)%
Europe 9,569 9,274 9,923 3(7) 65
APMEA 5,066 4,337 4,231 17 396
Other Countries & Corporate 1,328 1,190 1,290 12 (8) 4(2)
Total $24,075 $22,745 $23,522 6% (3)% 5% 2%
In the U.S., revenues in 2010 and 2009 were positively
impacted by the ongoing appeal of our iconic core products and
the success of new products, as well as continued focus on
everyday value and convenience. New products introduced in
2010 included McCafé frappés and smoothies as well as the
Angus Snack Wraps, while new products introduced in 2009
included McCafé premium coffees and the Angus Third Pounder.
Refranchising activity negatively impacted revenue growth in both
years.
Europe’s constant currency increases in revenues in 2010
and 2009 were primarily driven by comparable sales increases in
the U.K., France and Russia (which is entirely Company-
operated) as well as expansion in Russia. These increases were
partly offset by the impact of refranchising activity, primarily in the
U.K. in 2010 and the U.K. and Germany in 2009.
In APMEA, the constant currency increase in revenues in
2010 was primarily driven by comparable sales increases in
China, Australia and most other markets. The 2009 increase was
primarily driven by comparable sales increases in Australia and
most other Asian markets, partly offset by negative comparable
sales in China. In addition, expansion in China contributed to the
increases in both years.
14 McDonald’s Corporation Annual Report 2010