McDonalds 2010 Annual Report Download - page 23
Download and view the complete annual report
Please find page 23 of the 2010 McDonalds annual report below. You can navigate through the pages in the report by either clicking on the pages listed below, or by using the keyword search tool below to find specific information within the annual report.-
 1
1 -
2
-
3
-
4
-
5
-
6
-
7
-
8
-
9
-
10
-
11
-
12
-
 13
13 -
 14
14 -
 15
15 -
 16
16 -
 17
17 -
 18
18 -
 19
19 -
 20
20 -
 21
21 -
 22
22 -
 23
23 -
 24
24 -
 25
25 -
 26
26 -
 27
27 -
 28
28 -
 29
29 -
 30
30 -
 31
31 -
 32
32 -
 33
33 -
34
-
35
-
36
-
37
-
38
-
39
-
40
-
41
-
42
-
43
-
44
-
45
-
46
-
47
-
48
-
49
-
50
-
51
-
52
 |
 |

New restaurant investments in all years were concentrated in
markets with acceptable returns or opportunities for long-term
growth. Average development costs vary widely by market
depending on the types of restaurants built and the real estate
and construction costs within each market. These costs, which
include land, buildings and equipment, are managed through the
use of optimally sized restaurants, construction and design effi-
ciencies, and leveraging best practices. Although the Company is
not responsible for all costs for every restaurant opened, total
development costs (consisting of land, buildings and equipment)
for new traditional McDonald’s restaurants in the U.S. averaged
approximately $2.6 million in 2010.
The Company owned approximately 45% of the land and
about 70% of the buildings for restaurants in its consolidated
markets at year-end 2010 and 2009.
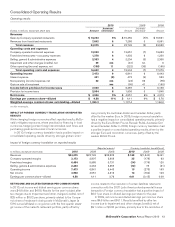
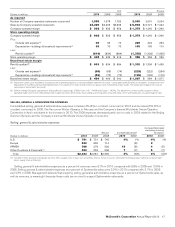
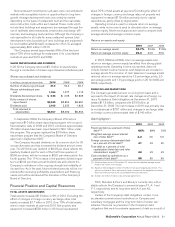
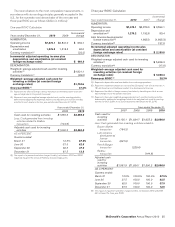
SHARE REPURCHASES AND DIVIDENDS
In 2010, the Company returned $5.1 billion to shareholders
through a combination of shares repurchased and dividends paid.
Shares repurchased and dividends
In millions, except per share data 2010 2009 2008
Number of shares repurchased 37.8 50.3 69.7
Shares outstanding at year
end 1,054 1,077 1,115
Dividends declared per share $ 2.26 $ 2.05 $1.625
Dollar amount of shares
repurchased $2,649 $2,854 $3,981
Dividends paid 2,408 2,235 1,823
Total returned to
shareholders $5,057 $5,089 $5,804
In September 2009, the Company’s Board of Directors
approved a $10 billion share repurchase program with no speci-
fied expiration date. In 2009 and 2010 combined, approximately
45 million shares have been repurchased for $3.1 billion under
this program. This program replaced the $10 billion share
repurchase program that the Company’s Board of Directors
approved in September 2007.
The Company has paid dividends on its common stock for 35
consecutive years and has increased the dividend amount every
year. The 2010 full year dividend of $2.26 per share reflects the
quarterly dividend paid for each of the first three quarters of
$0.55 per share, with an increase to $0.61 per share paid in the
fourth quarter. This 11% increase in the quarterly dividend equa-
tes to a $2.44 per share annual dividend rate and reflects the
Company’s confidence in the ongoing strength and reliability of
its cash flow. As in the past, future dividend amounts will be con-
sidered after reviewing profitability expectations and financing
needs, and will be declared at the discretion of the Company’s
Board of Directors.
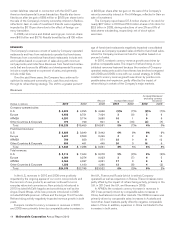
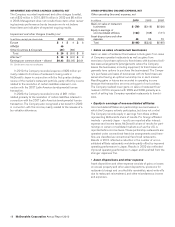
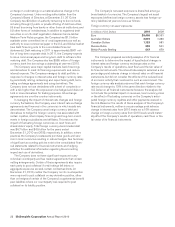
Financial Position and Capital Resources
TOTAL ASSETS AND RETURNS
Total assets increased $1.8 billion or 6% in 2010. Excluding the
effect of changes in foreign currency exchange rates, total
assets increased $1.7 billion in 2010. Over 70% of total assets
were in major markets at year-end 2010. Net property and
equipment increased $529 million in 2010 and represented
about 70% of total assets at year end. Excluding the effect of
changes in foreign currency exchange rates, net property and
equipment increased $719 million primarily due to capital
expenditures, partly offset by depreciation.
Operating income is used to compute return on average
assets, while net income is used to calculate return on average
common equity. Month-end balances are used to compute both
average assets and average common equity.
Returns on assets and equity
2010 2009 2008
Return on average assets 24.7% 23.4% 21.8%
Return on average common equity 35.3 34.0 30.6
In 2010, 2009 and 2008, return on average assets and
return on average common equity benefited from strong global
operating results. Operating income, as reported, does not
include interest income; however, cash balances are included in
average assets. The inclusion of cash balances in average assets
reduced return on average assets by 1.9 percentage points, 2.0
percentage points and 1.9 percentage points in 2010, 2009 and
2008, respectively.
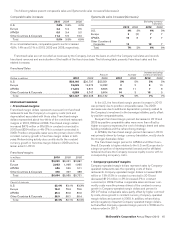
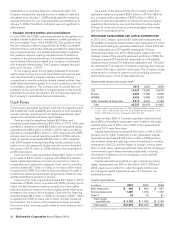
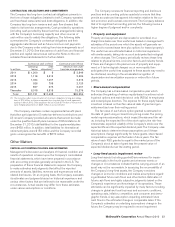
FINANCING AND MARKET RISK
The Company generally borrows on a long-term basis and is
exposed to the impact of interest rate changes and foreign cur-
rency fluctuations. Debt obligations at December 31, 2010
totaled $11.5 billion, compared with $10.6 billion at
December 31, 2009. The net increase in 2010 was primarily due
to net issuances of $787 million and changes in exchange rates
on foreign currency denominated debt of $140 million.
Debt highlights(1)
2010 2009 2008
Fixed-rate debt as a percent of total
debt(2,3) 66% 68% 72%
Weighted-average annual interest
rate of total debt(3) 4.3 4.5 5.0
Foreign currency-denominated debt
as a percent of total debt(2) 41 43 45
Total debt as a percent of total
capitalization (total debt and total
shareholders’ equity)(2) 44 43 43
Cash provided by operations as a
percent of total debt(2) 55 55 59
(1) All percentages are as of December 31, except for the weighted-average annual
interest rate, which is for the year.
(2) Based on debt obligations before the effect of fair value hedging adjustments. This
effect is excluded as these adjustments have no impact on the obligation at maturity.
See Debt financing note to the consolidated financial statements.
(3) Includes the effect of interest rate exchange agreements.
Fitch, Standard & Poor’s and Moody’s currently rate, with a
stable outlook, the Company’s commercial paper F1, A-1 and
P-1, respectively; and its long-term debt A, A and A2,
respectively.
Certain of the Company’s debt obligations contain cross-
acceleration provisions and restrictions on Company and
subsidiary mortgages and the long-term debt of certain sub-
sidiaries. There are no provisions in the Company’s debt
obligations that would accelerate repayment of debt as a result of
McDonald’s Corporation Annual Report 2010 21