McDonalds 2010 Annual Report Download - page 27
Download and view the complete annual report
Please find page 27 of the 2010 McDonalds annual report below. You can navigate through the pages in the report by either clicking on the pages listed below, or by using the keyword search tool below to find specific information within the annual report.-
 1
1 -
2
-
3
-
4
-
5
-
6
-
7
-
8
-
9
-
10
-
11
-
12
-
13
-
14
-
15
-
16
-
 17
17 -
 18
18 -
 19
19 -
 20
20 -
 21
21 -
 22
22 -
 23
23 -
 24
24 -
 25
25 -
 26
26 -
 27
27 -
 28
28 -
 29
29 -
 30
30 -
 31
31 -
 32
32 -
 33
33 -
 34
34 -
 35
35 -
 36
36 -
 37
37 -
38
-
39
-
40
-
41
-
42
-
43
-
44
-
45
-
46
-
47
-
48
-
49
-
50
-
51
-
52
 |
 |

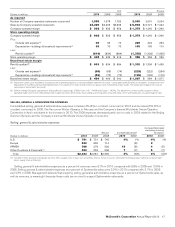
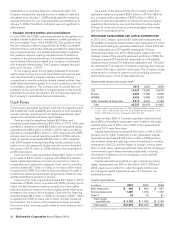
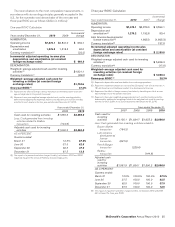
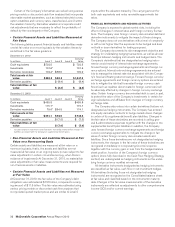
The reconciliations to the most comparable measurements, in
accordance with accounting principles generally accepted in the
U.S., for the numerator and denominator of the one-year and
three-year ROIIC are as follows (dollars in millions):
One-year ROIIC Calculation
Years ended December 31, 2010 2009 Incremental
change
NUMERATOR:
Operating income $7,473.1 $6,841.0 $ 632.1
Depreciation and
amortization 1,276.2 1,216.2 60.0
Currency translation(1) (22.2)
Incremental adjusted operating income plus
depreciation and amortization (at constant
foreign exchange rates) $ 669.9
DENOMINATOR:
Weighted–average adjusted cash used for investing
activities(2) $1,821.1
Currency translation(1) (26.5)
Weighted–average adjusted cash used for
investing activities (at constant foreign
exchange rates) $1,794.6
One-year ROIIC(3) 37.3%
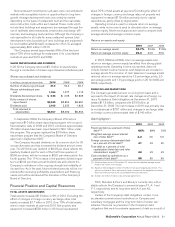
(1) Represents the effect of foreign currency translation by translating results at an aver-
age exchange rate for the periods measured.
(2) Represents one-year weighted-average adjusted cash used for investing activities,
determined by applying the weightings below to the adjusted cash used for investing
activities for each quarter in the two-year period ended December 31, 2010.
Years ended December 31,
2009 2010
Cash used for investing activities $1,655.3 $2,056.0
Less: Cash generated from investing
activities related to Redbox
transaction (144.9)
Adjusted cash used for investing
activities $1,800.2 $2,056.0
AS A PERCENT
Quarters ended:
March 31 12.5% 87.5%
June 30 37.5 62.5
September 30 62.5 37.5
December 31 87.5 12.5
(3) The impact of impairment and other charges (credits), net between 2010 and 2009
negatively impacted the one-year ROIIC by 4.3 percentage points.
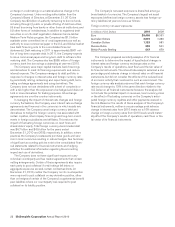
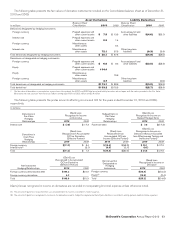
Three-year ROIIC Calculation
Years ended December 31, 2010 2007
Incremental
change
NUMERATOR:
Operating income $7,473.1 $3,879.0 $ 3,594.1
Depreciation and
amortization(4) 1,276.2 1,192.8 83.4
Latin America developmental
license transaction(5) 1,665.3 (1,665.3)
Currency translation(6) 137.8
Incremental adjusted operating income plus
depreciation and amortization (at constant
foreign exchange rates) $ 2,150.0
DENOMINATOR:
Weighted–average adjusted cash used for investing
activities(7) $ 5,626.3
Currency translation(6) (17.9)
Weighted–average adjusted cash used for
investing activities (at constant foreign
exchange rates) $ 5,608.4
Three-year ROIIC(8) 38.3%
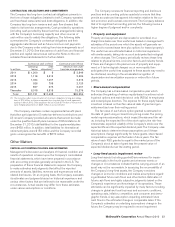
(4) Represents depreciation and amortization from continuing operations.
(5) Represents impairment charges as a result of the Company’s sale of its businesses in
18 Latin American and Caribbean markets to a developmental licensee.
(6) Represents the effect of foreign currency translation by translating results at an aver-
age exchange rate for the periods measured.
(7) Represents three-year weighted-average adjusted cash used for investing activities,
determined by applying the weightings below to the adjusted cash used for investing
activities for each quarter in the four-year period ended December 31, 2010.
Years ended December 31,
2007 2008 2009 2010
Cash used for
investing
activities $1,150.1 $1,624.7 $1,655.3 $2,056.0
Less: Cash generated from investing activities related to
Boston Market
transaction (184.3)
Latin America
developmental
license
transaction (647.5)
Pret A Manger
transaction (229.4)
Redbox
transaction (144.9)
Adjusted cash
used for
investing
activities $1,981.9 $1,854.1 $1,800.2 $2,056.0
AS A PERCENT
Quarters ended:
March 31 12.5% 100.0% 100.0% 87.5%
June 30 37.5 100.0 100.0 62.5
September 30 62.5 100.0 100.0 37.5
December 31 87.5 100.0 100.0 12.5
(8) The impact of impairment and other charges (credits), net between 2010 and 2007
did not impact the three-year ROIIC.
McDonald’s Corporation Annual Report 2010 25