McDonalds 2010 Annual Report Download - page 21
Download and view the complete annual report
Please find page 21 of the 2010 McDonalds annual report below. You can navigate through the pages in the report by either clicking on the pages listed below, or by using the keyword search tool below to find specific information within the annual report.-
 1
1 -
2
-
3
-
4
-
5
-
6
-
7
-
8
-
9
-
10
-
 11
11 -
 12
12 -
 13
13 -
 14
14 -
 15
15 -
 16
16 -
 17
17 -
 18
18 -
 19
19 -
 20
20 -
 21
21 -
 22
22 -
 23
23 -
 24
24 -
 25
25 -
 26
26 -
 27
27 -
 28
28 -
 29
29 -
 30
30 -
 31
31 -
32
-
33
-
34
-
35
-
36
-
37
-
38
-
39
-
40
-
41
-
42
-
43
-
44
-
45
-
46
-
47
-
48
-
49
-
50
-
51
-
52
 |
 |

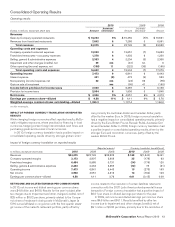
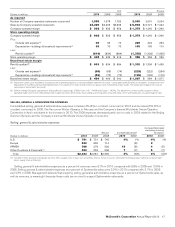
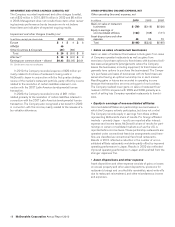
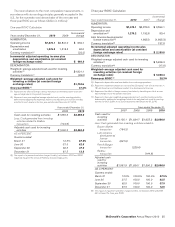
OPERATING INCOME
Operating income
Amount Increase/(decrease)
Increase/(decrease)
excluding currency
translation
Dollars in millions 2010 2009 2008 2010 2009 2010 2009
U.S. $3,446 $3,232 $3,060 7% 6% 7% 6%
Europe 2,797 2,588 2,608 8(1) 12 8
APMEA 1,200 989 819 21 21 11 23
Other Countries & Corporate 30 32 (44) (6) nm (43) nm
Total $7,473 $6,841 $6,443 9% 6% 9% 10%
nm Not meaningful.
In the U.S., 2010 results increased due to higher combined res-
taurant margin dollars. Results for 2009 increased primarily due
to higher franchised margin dollars.
In Europe, results for 2010 and 2009 were driven by stronger
operating performance in France, Russia and the U.K.
In APMEA, 2010 results increased due to stronger results in
Australia and many other markets. The Company’s share of
impairment charges related to restaurant closings in Japan neg-
atively impacted the growth rate by 4 percentage points for the
year. Results for 2009 were driven primarily by strong results in
Australia and expansion in China.
In Other Countries & Corporate, results for 2010 and 2009
included income of $21 million and $65 million, respectively,
primarily related to the resolution of certain liabilities retained in
connection with the 2007 Latin America developmental license
transaction.
• Combined operating margin
Combined operating margin is defined as operating income as a
percent of total revenues. Combined operating margin for 2010,
2009 and 2008 was 31.0%, 30.1% and 27.4%, respectively.
Impairment and other charges (credits), net negatively impacted
the combined operating margin by 0.2 percentage points in
2010, while positively impacting it by 0.3 percentage points in
2009.
INTEREST EXPENSE
Interest expense decreased in 2010 primarily due to lower aver-
age interest rates slightly offset by higher average debt balances.
Interest expense decreased in 2009 primarily due to lower aver-
age interest rates, and to a lesser extent, weaker foreign
currencies, partly offset by higher average debt levels.
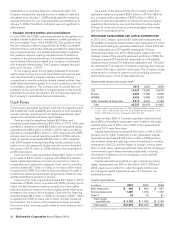
NONOPERATING (INCOME) EXPENSE, NET
Nonoperating (income) expense, net
In millions 2010 2009 2008
Interest income $(20) $(19) $(85)
Foreign currency and hedging
activity (2) (32) (5)
Other expense 44 27 12
Total $22 $(24) $(78)
Interest income consists primarily of interest earned on short-
term cash investments. Interest income decreased in 2009
primarily due to lower average interest rates. Foreign currency
and hedging activity primarily relates to net gains or losses on
certain hedges that reduce the exposure to variability on certain
intercompany foreign currency cash flow streams. Other expense
primarily consists of amortization of debt issuance costs and
other nonoperating income and expenses.
GAIN ON SALE OF INVESTMENT
In 2009, the Company sold its minority ownership interest in
Redbox to Coinstar, Inc., the majority owner, for total consid-
eration of $140 million. As a result of the transaction, the
Company recognized a nonoperating pretax gain of $95 million
(after tax–$59 million or $0.05 per share).
In 2008, the Company sold its minority ownership interest in
U.K.-based Pret A Manger. In connection with the sale, the
Company received cash proceeds of $229 million and recog-
nized a nonoperating pretax gain of $160 million (after tax–$109
million or $0.09 per share).
PROVISION FOR INCOME TAXES
In 2010, 2009 and 2008, the reported effective income tax rates
were 29.3%, 29.8% and 30.0%, respectively.
In 2010, the effective income tax rate decreased due to
higher tax benefits related to foreign operations.
In 2009, the effective income tax rate benefited by 0.7 per-
centage points primarily due to the resolution of certain liabilities
retained in connection with the 2007 Latin America devel-
opmental license transaction.
Consolidated net deferred tax liabilities included tax assets,
net of valuation allowance, of $1.6 billion and $1.4 billion in 2010
and 2009, respectively. Substantially all of the net tax assets
arose in the U.S. and other profitable markets.
ACCOUNTING CHANGES
• Fair value measurements
In 2006, the Financial Accounting Standards Board (FASB)
issued guidance on fair value measurements, codified primarily in
the Fair Value Measurements and Disclosures Topic of the FASB
Accounting Standards Codification (ASC). This guidance defines
fair value, establishes a framework for measuring fair value in
accordance with generally accepted accounting principles, and
expands disclosures about fair value measurements. This guid-
ance does not require any new fair value measurements; rather, it
applies to other accounting pronouncements that require or
permit fair value measurements. The provisions of the guidance,
as issued, were effective January 1, 2008. However, in February
2008, the FASB deferred the effective date for one year for cer-
tain non-financial assets and non-financial liabilities, except those
that are recognized or disclosed at fair value in the financial
McDonald’s Corporation Annual Report 2010 19