Microsoft 2003 Annual Report Download - page 23
Download and view the complete annual report
Please find page 23 of the 2003 Microsoft annual report below. You can navigate through the pages in the report by either clicking on the pages listed below, or by using the keyword search tool below to find specific information within the annual report.-
 1
1 -
2
-
3
-
4
-
5
-
6
-
7
-
8
-
9
-
10
-
11
-
12
-
 13
13 -
 14
14 -
 15
15 -
 16
16 -
 17
17 -
 18
18 -
 19
19 -
 20
20 -
 21
21 -
 22
22 -
 23
23 -
 24
24 -
 25
25 -
 26
26 -
 27
27 -
 28
28 -
 29
29 -
 30
30 -
 31
31 -
 32
32 -
 33
33 -
34
-
35
-
36
-
37
-
38
-
39
-
40
-
41
-
42
-
43
-
44
-
45
-
46
-
47
-
48
-
49
-
50
-
51
-
52
-
53
-
54
-
55
-
56
-
57
-
58
-
59
-
60
-
61
 |
 |

Part II, Item 7,
MSFT 2003 FORM 10-K
10 /
REVENUE
Our revenue growth rate was 10% in fiscal 2001, 12% in fiscal 2002, and 13% in fiscal 2003. Revenue growth in fiscal 2003 was driven primarily by multi-year
licensing that occurred before the transition to our new licensing program (Licensing 6.0) in the first quarter of fiscal 2003. Prior to the July 31, 2002 transition date
to Licensing 6.0, we experienced significant growth in multi-year licensing arrangements as customers enrolled in our maintenance programs, including Upgrade
Advantage and Software Assurance. The revenue growth also reflected a $933 million or 13% increase associated with OEM licensing of Microsoft Windows
operating systems and a $309 million or 23% increase in revenue from Microsoft Xbox video game consoles. Revenue growth in fiscal 2002 was led by the
addition of $1.35 billion of Xbox video game system revenue and $1.20 billion of revenue growth from Microsoft Windows XP Professional and Home operating
systems. Revenue growth in fiscal 2001 was driven primarily by licensing of Microsoft Windows 2000 Professional with $1.01 billion growth in revenue from
Professional operating systems, and Server and Tools revenue growth of $852 million.
During the second quarter of fiscal 2002, we launched a new licensing program, Licensing 6.0, for volume licensing customers. Licensing 6.0 simplifies and
improves our volume licensing program with Software Assurance, which gives customers the right to install any new release of products covered in the licensing
agreement during the term of their coverage. The level of customer adoption of our new volume licensing programs will affect the mix of multi-year licensing
agreements with a resulting impact on the timing of revenue recognition. In addition, the timing and extent of a recovery in consumer and corporate spending on
PCs and information technology will be factors affecting revenue growth.
CONSOLIDATED OPERATING INCOME
Operating income grew 6% in fiscal 2001, 2% in fiscal 2002, and 11% in fiscal 2003. In fiscal 2003, the growth in operating income reflected an increase of $3.82
billion in revenue, partially offset by an increase of $2.52 billion in operating expenses, primarily related to employee and related costs associated with additional
headcount and increased legal settlement expenses. In fiscal 2002, the growth in operating income reflected an increase of $3.07 billion in revenue, substantially
offset by an increase of $2.88 billion in operating expenses, which included the onset of costs related to Xbox video game systems. In fiscal 2001, the growth in
operating income reflected an increase of $2.34 billion in revenue, partially offset by an increase of $1.63 billion in operating expenses.
SEGMENT PRODUCT REVENUE/OPERATING INCOME (LOSS)
We revised our segments for fiscal year 2003. Our seven segments are:
Client
Server and Tools
Information Worker
Microsoft Business Solutions
MSN
Mobile and Embedded Devices
Home and Entertainment
The revenue and operating income/(loss) amounts in this MD&A are presented in accordance with U.S. GAAP. Segment Information appearing in Note 21 of
the Notes to Financial Statements are presented in accordance with SFAS 131, Disclosures about Segments of an Enterprise and Related Information.
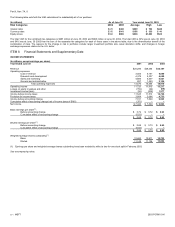
The following table presents our segment revenue and operating income, determined in accordance with U.S. GAAP:
(In millions) Revenue Operating Income/(Loss)
Y
ear Ended June 30 2002 2003 2002 2003
Client $ 9,360 $ 10,394 $ 7,576 $ 8,400
Server and Tools 6,157 7,140 2,048 2,457
Information Worker 8,212 9,229 6,448 7,037
Microsoft Business Solutions 308 567 (176) (254)
MSN 1,571 1,953 (641) (299)
Mobile and Embedded Devices 112 156 (157) (157)
Home and Entertainment 2,453 2,748 (874) (924)
Other 192
—
(2,314) (3,043)
Consolidated $ 28,365 $ 32,187 $11,910 $13,217
Client
Client revenue was $8.17 billion, $9.36 billion, and $10.39 billion in 2001, 2002, and 2003. Client includes revenue from Windows XP Professional and Home,
Windows 2000 Professional, and other standard Windows operating systems. In 2003, Client revenue growth was driven by OEM licensing revenue growth of
$933 million and a 9 percentage point increase of the mix of the higher priced Windows Professional operating systems, the majority of which was in the OEM
channel. Windows Professional revenue growth for fiscal 2003 was $1.59 billion or 31% compared to fiscal 2002, partially offset by a $573 million decline in
revenue of