Microsoft 2003 Annual Report Download - page 41
Download and view the complete annual report
Please find page 41 of the 2003 Microsoft annual report below. You can navigate through the pages in the report by either clicking on the pages listed below, or by using the keyword search tool below to find specific information within the annual report.-
 1
1 -
2
-
3
-
4
-
5
-
6
-
7
-
8
-
9
-
10
-
11
-
12
-
13
-
14
-
15
-
16
-
17
-
18
-
19
-
20
-
21
-
22
-
23
-
24
-
25
-
26
-
27
-
28
-
29
-
30
-
 31
31 -
 32
32 -
 33
33 -
 34
34 -
 35
35 -
 36
36 -
 37
37 -
 38
38 -
 39
39 -
 40
40 -
 41
41 -
 42
42 -
 43
43 -
 44
44 -
 45
45 -
 46
46 -
 47
47 -
 48
48 -
 49
49 -
 50
50 -
 51
51 -
52
-
53
-
54
-
55
-
56
-
57
-
58
-
59
-
60
-
61
 |
 |

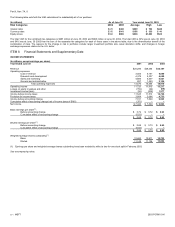
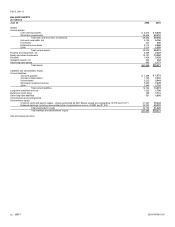
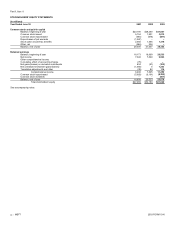
Part II, Item 8
MSFT 2003 FORM 10-K
28 /
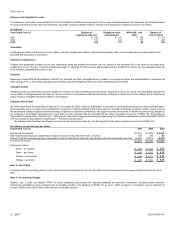
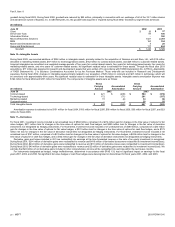
Note 7—Property and Equipment
(In millions)
June 30 2002 2003
Land $ 197 $ 248
Buildings 1,701 1,854
Computer equipment and software 2,621 2,464
Other 1,372 1,512
Property and equipment – at cost 5,891 6,078
Accumulated depreciation (3,623) (3,855)
Property and equipment – net $ 2,268 $ 2,223
During 2001, 2002, and 2003, depreciation expense, the majority of which related to computer equipment, was $764 million, $820 million, and $929 million.
Note 8—Equity and Other Investments
(In millions) Cost
Basis Unrealized
Gains Unrealized
Losses Recorded
Basis
June 30, 2002
Debt securities recorded at market, maturing:
Within one year $ 485 $ 26 $ – $ 511
Between 2 and 10 years 893 46 (4) 935
Between 10 and 15 years 541 19 (2) 558
Beyond 15 years 3,036
–
– 3,036
Debt securities recorded at market 4,955 91 (6) 5,040
Common stock and warrants 6,580 1,287 (617) 7,250
Preferred stock 1,382
–
– 1,382
Other investments 519
–
– 519
Equity and other investments $ 13,436 $ 1,378 $ (623) $ 14,191
(In millions) Cost Basis Unrealized
Gains Unrealized
Losses Recorded
Basis
June 30, 2003
Debt securities recorded at market, maturing:
Within one year $ 293 $ 9 $
–
$ 302
Between 2 and 10 years 1,436 194 (73) 1,557
Debt securities recorded at market 1,729 203 (73) 1,859
Common stock and warrants 8,395 1,686 (3) 10,078
Preferred stock 1,262
–
–
1,262
Other investments 493
–
–
493
Equit
y
and other investments $ 11,879 $ 1,889 $ (76) $ 13,692
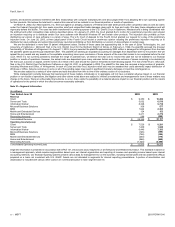
Debt securities include corporate and government notes and bonds and derivative securities. In connection with the definitive agreement to combine AT&T
Broadband with Comcast into a new company called Comcast Corporation, Microsoft exchanged its AT&T 5% convertible preferred debt for 115 million shares of
Comcast Corporation on November 18, 2002, resulting in a $20 million net recognized loss.
Common and preferred stock and other investments that are restricted for more than one year or are not publicly traded are recorded at cost. At June 30, 2002
the recorded basis of these investments was $2.31 billion, and their estimated fair value was $2.28 billion. At June 30, 2003, the recorded basis of these
investments was $2.15 billion, and their estimated fair value was $2.56 billion. The estimate of fair value is based on publicly available market information or other
estimates determined by management. Realized gains and (losses) from equity and other investments (excluding impairments) were $3.03 billion and $(23) million
in 2001, $2.24 billion and $(121) million in 2002, and $540 million and $(88) million in 2003.
Note 9—Goodwill
During fiscal 2003, goodwill increased by approximately $1.7 billion. The increase related principally to the following acquisitions: Navision a/s with $1.2 billion
allocated to Microsoft Business Solutions, $281 million for the Rare, Ltd. acquisition allocated to Home and Entertainment, and Placeware, Inc. with $180 million
allocated to Information Worker. No impairment was charged to