Microsoft 2003 Annual Report Download - page 40
Download and view the complete annual report
Please find page 40 of the 2003 Microsoft annual report below. You can navigate through the pages in the report by either clicking on the pages listed below, or by using the keyword search tool below to find specific information within the annual report.-
 1
1 -
2
-
3
-
4
-
5
-
6
-
7
-
8
-
9
-
10
-
11
-
12
-
13
-
14
-
15
-
16
-
17
-
18
-
19
-
20
-
21
-
22
-
23
-
24
-
25
-
26
-
27
-
28
-
29
-
 30
30 -
 31
31 -
 32
32 -
 33
33 -
 34
34 -
 35
35 -
 36
36 -
 37
37 -
 38
38 -
 39
39 -
 40
40 -
 41
41 -
 42
42 -
 43
43 -
 44
44 -
 45
45 -
 46
46 -
 47
47 -
 48
48 -
 49
49 -
 50
50 -
51
-
52
-
53
-
54
-
55
-
56
-
57
-
58
-
59
-
60
-
61
 |
 |

Part II, Item 8
MSFT 2003 FORM 10-K
27 /
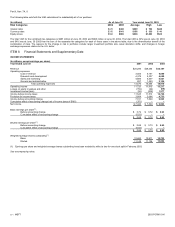
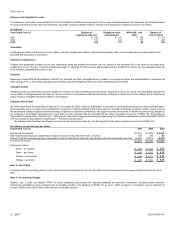
Of the $9.02 billion of unearned revenue at June 30, 2003, $2.65 billion is expected to be recognized in the first quarter of fiscal 2004, $2.05 billion in the
second quarter of fiscal 2004, $1.53 billion in the third quarter of fiscal 2004, $1.00 billion in the fourth quarter of fiscal 2004, and $1.79 billion thereafter.
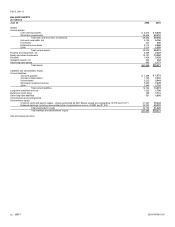
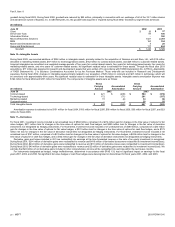
Note 5—Cash and Short-Term Investments
(In millions) Cost
Basis Unrealized
Gains Unrealized
Losses Recorded
Basis
June 30, 2002
Cash and equivalents:
Cash $ 1,114 $ –
$ – $ 1,114
Commercial paper 260 –
– 260
Certificates of deposit 31 –
– 31
Money market mutual funds 714 –
– 714
Corporate notes and bonds 560 –
– 560
Municipal securities 337 –
– 337
Cash and equivalents 3,016 –
– 3,016
Short-term investments:
Commercial paper 552 –
— 552
U.S. government and agency securities 8,745 91
(12) 8,824
Corporate notes and bonds 14,577 255
(241) 14,591
Mortgage-backed securities 6,226 23
(1) 6,248
Municipal securities 4,462 86
– 4,548
Certificates of deposit 873 –
– 873
Short-term investments 35,435 455
(254) 35,636
Cash and short-term investments $ 38,451 $ 455
$ (254) $ 38,652
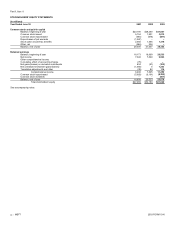
(In millions) Cost
Basis Unrealized
Gains Unrealized
Losses Recorded
Basis
June 30, 2003
Cash and equivalents:
Cash $ 1,308 $
–
$
–
$ 1,308
Commercial paper 774
–
–
774
U.S. government and agency securities 1,889
–
–
1,889
Certificates of deposit 28
–
–
28
Money market mutual funds 1,263
–
–
1,263
Corporate notes and bonds 744 95 (11) 828
Municipal securities 348
–
–
348
Cash and equivalents 6,354 95 (11) 6,438
Short-term investments:
Commercial paper 100
–
–
100
U.S. government and agency securities 5,316 126 (28) 5,414
Foreign government bonds 5,364 79 (16) 5,427
Corporate notes and bonds 15,440 735 (86) 16,089
Mortgage-backed securities 6,257 65 (3) 6,319
Municipal securities 8,733 265 (6) 8,992
Certificates of deposit 269
–
–
269
Short-term investments 41,479 1,270 (139) 42,610
Cash and short-term investments $ 47,833 $ 1,365 $ (150) $ 49,048
Realized gains and (losses) from cash and short-term investments (excluding impairments) were $541 million and $(369) million in 2001, $816 million and $(558)
million in 2002 and $1.42 billion and $(957) million in 2003.
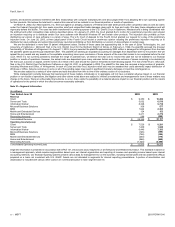
Note 6—Inventories
(In millions)
June 30 2002 2003
Finished goods $ 505 $ 393
Raw materials and work in process 168 247
Inventories $ 673 $ 640