Microsoft 2003 Annual Report Download - page 46
Download and view the complete annual report
Please find page 46 of the 2003 Microsoft annual report below. You can navigate through the pages in the report by either clicking on the pages listed below, or by using the keyword search tool below to find specific information within the annual report.-
 1
1 -
2
-
3
-
4
-
5
-
6
-
7
-
8
-
9
-
10
-
11
-
12
-
13
-
14
-
15
-
16
-
17
-
18
-
19
-
20
-
21
-
22
-
23
-
24
-
25
-
26
-
27
-
28
-
29
-
30
-
31
-
32
-
33
-
34
-
35
-
 36
36 -
 37
37 -
 38
38 -
 39
39 -
 40
40 -
 41
41 -
 42
42 -
 43
43 -
 44
44 -
 45
45 -
 46
46 -
 47
47 -
 48
48 -
 49
49 -
 50
50 -
 51
51 -
 52
52 -
 53
53 -
 54
54 -
 55
55 -
 56
56 -
57
-
58
-
59
-
60
-
61
 |
 |

Part II, Item 8
MSFT 2003 FORM 10-K
33 /
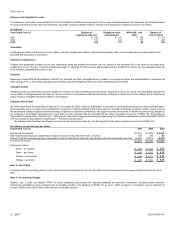
Stock options outstanding were as follows:
(In millions, except earnings per share)
Price per Share
Shares Range
Weighted
Average
Balance, June 30, 2000 1,664 $ 0.28 – $59.57 $20.62
Granted 448 20.75 – 40.00 30.42
Exercised (246) 0.30 – 42.91 5.57
Canceled (70) 6.92 – 59.57 31.79
Balance, June 30, 2001 1,796 0.28 – 59.57 24.77
Granted 82 24.31 – 36.29 31.25
Exercised (198) 0.51 – 34.91 6.41
Canceled (76) 0.58 – 58.28 34.34
Balance, June 30, 2002 1,604 0.40 – 59.57 26.88
Granted 254 21.42
–
29.12 24.27
Exercised (234) 0.51
–
28.22 6.89
Canceled (75) 2.13
–
59.56 34.33
Balance, June 30, 2003 1,549 0.40
–
59.56 29.30
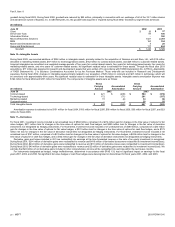
For various price ranges, weighted average characteristics of outstanding stock options at June 30, 2003 were as follows:
(In millions, except earnings per share)
Outstanding Options Exercisable Options
Range of Exercise Prices Shares
Remaining
Life (Years)
Weighted
Average Price Shares
Weighted
Average Price
$ 0.39
–
$15.00 124 3.7 $6.29 117 $6.23
15.01
–
25.00 359 5.6 21.30 131 16.54
25.01
–
33.00 415 5.8 28.24 177 27.92
33.01
–
41.00 387 3.2 34.26 196 34.34
41.01
–
59.56 264 2.4 44.90 153 44.73
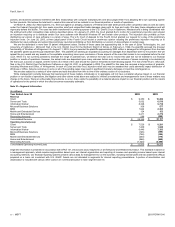
We follow Accounting Principles Board Opinion 25 to account for stock option and employee stock purchase plans. An alternative method of accounting for
stock options is SFAS 123. Under SFAS 123, employee stock options are valued at grant date using the Black-Scholes valuation model, and this compensation
cost is recognized ratably over the vesting period. In addition to announcing changes to our employee compensation arrangements in July 2003, we also indicated
that we will adopt the fair value recognition provisions of SFAS 123 effective July 1, 2003 and will report that change in accounting principle using the retroactive
restatement method described in SFAS 148.
Had compensation cost for our stock option and employee stock purchase plans been determined as prescribed by SFAS 123, pro forma income statements
for 2001, 2002, and 2003 would have been as follows:
(In millions, except earnings per share)
Y
ear Ended June 30 2001 2002 2003
Reported Pro Forma Reported Pro Forma Reported Pro Forma
Revenue $ 25,296 $ 25,296 $ 28,365 $ 28,365 $ 32,187 $ 32,187
Operating expenses:
Cost of revenue 3,455 3,775 5,191 5,699 5,686 6,059
Research and development 4,379 6,106 4,307 6,299 4,659 6,595
Sales and marketing 4,885 5,888 5,407 6,252 6,521 7,562
General and administrative 857 1,184 1,550 1,843 2,104 2,426
Total operating expenses 13,576 16,953 16,455 20,093 18,970 22,642
Operating income 11,720 8,343 11,910 8,272 13,217 9,545
Losses on equity investees and other (159) (159) (92) (92) (68) (68)
Investment income/(loss) (36) (36) (305) (305) 1,577 1,577
Income before income taxes 11,525 8,148 11,513 7,875 14,726 11,054
Provision for income taxes 3,804 2,689 3,684 2,520 4,733 3,523
Income before accounting change 7,721 5,459 7,829 5,355 9,993 7,531
Cumulative effect of accounting change (375) (375) – –
–
–
Net income $ 7,346 $ 5,084 $ 7,829 $ 5,355 $ 9,993 $ 7,531
Basic earnings per share $ 0.69 $ 0.48 $ 0.72 $ 0.50 $ 0.93 $ 0.70
Diluted earnings per share $ 0.66 $ 0.46 $ 0.70 $ 0.48 $ 0.92 $ 0.69