Microsoft 2003 Annual Report Download - page 42
Download and view the complete annual report
Please find page 42 of the 2003 Microsoft annual report below. You can navigate through the pages in the report by either clicking on the pages listed below, or by using the keyword search tool below to find specific information within the annual report.-
 1
1 -
2
-
3
-
4
-
5
-
6
-
7
-
8
-
9
-
10
-
11
-
12
-
13
-
14
-
15
-
16
-
17
-
18
-
19
-
20
-
21
-
22
-
23
-
24
-
25
-
26
-
27
-
28
-
29
-
30
-
31
-
 32
32 -
 33
33 -
 34
34 -
 35
35 -
 36
36 -
 37
37 -
 38
38 -
 39
39 -
 40
40 -
 41
41 -
 42
42 -
 43
43 -
 44
44 -
 45
45 -
 46
46 -
 47
47 -
 48
48 -
 49
49 -
 50
50 -
 51
51 -
 52
52 -
53
-
54
-
55
-
56
-
57
-
58
-
59
-
60
-
61
 |
 |

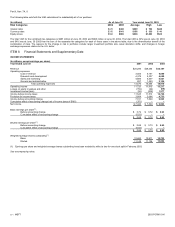
Part II, Item 8
MSFT 2003 FORM 10-K
29 /
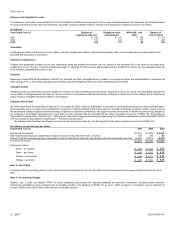
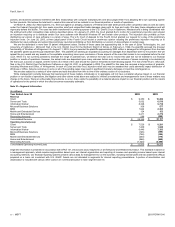
goodwill during fiscal 2003. During fiscal 2002, goodwill was reduced by $85 million, principally in connection with our exchange of all of the 33.7 million shares
and warrants we owned of Expedia, Inc. to USA Networks, Inc. No goodwill was acquired or impaired during fiscal 2002. Goodwill by segment was as follows:
(In millions)
June 30 2002 2003
Client $ 26 $ 37
Server and Tools 97 106
Information Worker – 180
Microsoft Business Solutions 1,021 2,219
MSN 160 154
Mobile and Embedded Devices 5 28
Home and Entertainment 117 404
Goodwill $ 1,426 $ 3,128
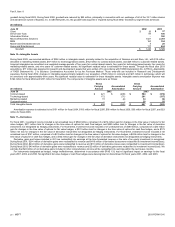
Note 10—Intangible Assets
During fiscal 2003, we recorded additions of $306 million in intangible assets, primarily related to the acquisition of Navision a/s and Rare, Ltd., with $19 million
allocated to marketing related assets, $97 million to technology-based assets, $162 million to contract based assets, and $28 million to customer-related assets.
Acquired intangibles are amortized over weighted average periods of five years for contract-based assets, four years for technology-based assets, four years for
marketing-related assets, and nine years for customer-related assets. No significant residual value is estimated for these assets. Through the fiscal year 2003
acquisitions, $17 million was assigned to research and development assets that were written off in accordance with FASB Interpretation No. 4 (FIN 4), Applicability
of FASB Statement No. 2 to Business Combinations Accounted for by the Purchase Method. Those write-offs are included in Research and Development
expenses. During fiscal 2002, changes in intangible assets primarily related to our acquisition of $25 million in contracts and $27 million in technology, which will
be amortized over approximately three years. No significant residual value is estimated for these intangible assets. Intangible assets amortization expense was
$194 million for fiscal 2002 and $161 million for fiscal 2003. The components of intangible assets were as follows:
(In millions)
Gross
Carrying
Amount
Accumulated
Amortization
Gross
Carrying
Amount
Accumulated
Amortization
June 30 2002 2003
Contract-based $ 421 $ (290) $ 584 $ (376)
Technology-based 172 (71) 261 (137)
Marketing-related 15 (4) 34 (9)
Customer-related
–
– 28 (1)
Total Intangible Assets $ 608 $ (365) $ 907 $ (523)
Amortization expense is estimated to be $151 million for fiscal 2004, $103 million for fiscal 2005, $56 million for fiscal 2006, $39 million for fiscal 2007, and $23
million for fiscal 2008.
Note 11—Derivatives
For fiscal 2001, investment income included a net unrealized loss of $592 million, comprised of a $214 million gain for changes in the time value of options for fair
value hedges, $211 million loss for changes in the time value of options for cash flow hedges, and $595 million loss for changes in the fair value of derivative
instruments not designated as hedging instruments. For fiscal 2002, investment income included a net unrealized loss of $480 million, comprised of a $30 million
gain for changes in the time value of options for fair value hedges, a $331 million loss for changes in the time value of options for cash flow hedges, and a $179
million net loss for changes in the fair value of derivative instruments not designated as hedging instruments. For fiscal 2003, investment income included a net
unrealized loss of $141 million, comprised of a $74 million loss for changes in the time value of options for fair value hedges, a $229 million loss for changes in the
time value of options for cash flow hedges, and a $162 million gain for changes in the fair value of derivative instruments not designated as hedging instruments.
Derivative gains and losses included in OCI are reclassified into earnings at the time forecasted revenue or the sale of an equity investment is recognized.
During fiscal 2001, $214 million of derivative gains were reclassified to revenue and $416 million of derivative losses were reclassified to investment income/(loss).
During fiscal 2002, $234 million of derivative gains were reclassified to revenue and $10 million of derivative losses were reclassified to investment income/(loss).
During fiscal 2003, $40 million of derivative gains were reclassified to revenue and $2 million of derivative gains were reclassified to investment income/(loss). We
estimate that $22 million of net derivative gains included in other comprehensive income will be reclassified into earnings within the next twelve months.
For instruments designated as hedges, hedge ineffectiveness, determined in accordance with SFAS 133, had no significant impact on earnings for the fiscal
years 2001, 2002, and 2003. No significant fair value hedges or cash flow hedges were derecognized or discontinued for fiscal years 2001, 2002, and 2003.