Microsoft 2003 Annual Report Download - page 32
Download and view the complete annual report
Please find page 32 of the 2003 Microsoft annual report below. You can navigate through the pages in the report by either clicking on the pages listed below, or by using the keyword search tool below to find specific information within the annual report.-
 1
1 -
2
-
3
-
4
-
5
-
6
-
7
-
8
-
9
-
10
-
11
-
12
-
13
-
14
-
15
-
16
-
17
-
18
-
19
-
20
-
21
-
 22
22 -
 23
23 -
 24
24 -
 25
25 -
 26
26 -
 27
27 -
 28
28 -
 29
29 -
 30
30 -
 31
31 -
 32
32 -
 33
33 -
 34
34 -
 35
35 -
 36
36 -
 37
37 -
 38
38 -
 39
39 -
 40
40 -
 41
41 -
 42
42 -
43
-
44
-
45
-
46
-
47
-
48
-
49
-
50
-
51
-
52
-
53
-
54
-
55
-
56
-
57
-
58
-
59
-
60
-
61
 |
 |

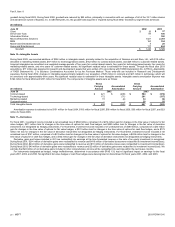
Part II, Item 7A, 8
MSFT 2003 FORM 10-K
19 /
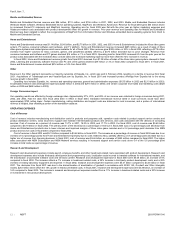
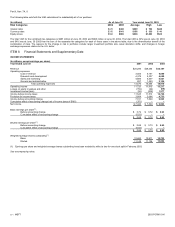
The following table sets forth the VAR calculations for substantially all of our positions:
(In millions)
A
so
f
June 30
Y
ear ended June 30, 2003
Risk Categories 2002 2003 Average High Low
Interest rates $472 $448 $609 $ 762 $448
Currency rates $310 $141 $156 $ 333 $ 41
Equity prices $602 $869 $838 $1,083 $523
The total VAR for the combined risk categories is $987 million at June 30, 2003 and $908 million at June 30, 2002. The total VAR is 32% less at June 30, 2003
and 34% less at June, 30 2002 than the sum of the separate risk categories for each of those years in the above table, due to the diversification benefit of the
combination of risks. The reasons for the change in risk in portfolios include: larger investment portfolio size, asset allocation shifts, and changes in foreign
exchange exposures relative to the U.S. dollar.
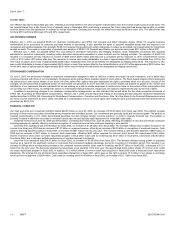
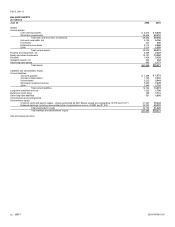
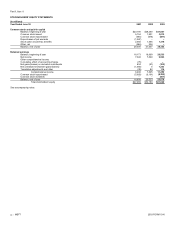
ITEM 8. Financial Statements and Supplementary Data
INCOME STATEMENTS
(In millions, except earnings per share)
Y
ear Ended June 30 2001 2002 2003
Revenue $25,296 $28,365 $32,187
Operating expenses:
Cost of revenue 3,455 5,191 5,686
Research and development 4,379 4,307 4,659
Sales and marketing 4,885 5,407 6,521
General and administrative 857 1,550 2,104
Total operating expenses 13,576 16,455 18,970
Operating income 11,720 11,910 13,217
Losses on equity investees and other (159) (92) (68)
Investment income/(loss) (36) (305) 1,577
Income before income taxes 11,525 11,513 14,726
Provision for income taxes 3,804 3,684 4,733
Income before accounting change 7,721 7,829 9,993
Cumulative effect of accounting change (net of income taxes of $185) (375) –
–
Net income $ 7,346 $ 7,829 $ 9,993
Basic earnings per share
(1)
:
Before accounting change $ 0.72 $ 0.72 $ 0.93
Cumulative effect of accounting change (0.03) –
–
$ 0.69 $ 0.72 $ 0.93
Diluted earnings per share
(1)
:
Before accounting change $ 0.69 $ 0.70 $ 0.92
Cumulative effect of accounting change (0.03) –
–
$ 0.66 $ 0.70 $ 0.92
Weighted average shares outstanding
(1)
:
Basic 10,683 10,811 10,723
Diluted 11,148 11,106 10,882
(1) Earnings per share and weighted average shares outstanding have been restated to reflect a two-for-one stock split in February 2003.
See accompanying notes.