Microsoft 2003 Annual Report Download - page 52
Download and view the complete annual report
Please find page 52 of the 2003 Microsoft annual report below. You can navigate through the pages in the report by either clicking on the pages listed below, or by using the keyword search tool below to find specific information within the annual report.-
 1
1 -
2
-
3
-
4
-
5
-
6
-
7
-
8
-
9
-
10
-
11
-
12
-
13
-
14
-
15
-
16
-
17
-
18
-
19
-
20
-
21
-
22
-
23
-
24
-
25
-
26
-
27
-
28
-
29
-
30
-
31
-
32
-
33
-
34
-
35
-
36
-
37
-
38
-
39
-
40
-
41
-
 42
42 -
 43
43 -
 44
44 -
 45
45 -
 46
46 -
 47
47 -
 48
48 -
 49
49 -
 50
50 -
 51
51 -
 52
52 -
 53
53 -
 54
54 -
 55
55 -
 56
56 -
 57
57 -
 58
58 -
 59
59 -
 60
60 -
 61
61
 |
 |

Part II, Item 8
MSFT 2003 FORM 10-K
39 /
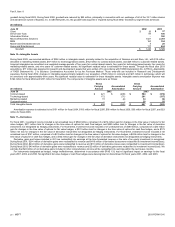
QUARTERLY INFORMATION
(In millions, except earnings per share) (Unaudited) Quarter Ended
Sept. 30 Dec. 31 Mar. 31 June 30 Year
Fiscal 2001
Revenue $ 5,766 $ 6,550 $ 6,403 $ 6,577 $ 25,296
Gross profit 4,941 5,686 5,504 5,710 21,841
Net income 2,206
(2)
2,624 2,451 65
(3)
7,346
Basic earnings per share
(1)
0.21
(2)
0.25 0.23 0.01 0.69
Diluted earnings per share
(1)
0.20
(2)
0.24 0.22 0.01 0.66
Fiscal 2002
Revenue $ 6,126 $ 7,741 $ 7,245 $ 7,253 $ 28,365
Gross profit 5,242 6,197 5,850 5,885 23,174
Net income 1,283
(4)
2,283 2,738
(5)
1,525
(6)
7,829
Basic earnings per share
(1)
0.12 0.21 0.25 0.14 0.72
Diluted earnings per share
(1)
0.12 0.21 0.25 0.14 0.70
Fiscal 2003
Revenue $ 7,746 $ 8,541 $ 7,835 $ 8,065 $ 32,187
Gross profit 6,547 6,507 6,620 6,827 26,501
Net income 2,726 2,552 2,794 1,921 9,993
Basic earnings per share 0.25 0.24 0.26 0.18 0.93
Diluted earnings per share 0.25 0.23 0.26 0.18 0.92
(1) Earnings per share have been restated to reflect a two-for-one stock split in February 2003.
(2) Includes an unfavorable cumulative effect of accounting change of $375 million or $0.03 per basic share and diluted share, reflecting the adoption of SFAS
No. 133.
(3) Includes $3.92 billion (pre-tax) in impairments of certain investments.
(4) Includes $1.82 billion (pre-tax) in impairments of certain investments.
(5) Includes $1.25 billion (pre-tax) gain on the sale of Expedia, Inc. and $1.19 billion (pre-tax) in impairments of certain investments.
(6) Includes $1.19 billion (pre-tax) in impairments of certain investments.