Microsoft 2003 Annual Report Download - page 39
Download and view the complete annual report
Please find page 39 of the 2003 Microsoft annual report below. You can navigate through the pages in the report by either clicking on the pages listed below, or by using the keyword search tool below to find specific information within the annual report.-
 1
1 -
2
-
3
-
4
-
5
-
6
-
7
-
8
-
9
-
10
-
11
-
12
-
13
-
14
-
15
-
16
-
17
-
18
-
19
-
20
-
21
-
22
-
23
-
24
-
25
-
26
-
27
-
28
-
 29
29 -
 30
30 -
 31
31 -
 32
32 -
 33
33 -
 34
34 -
 35
35 -
 36
36 -
 37
37 -
 38
38 -
 39
39 -
 40
40 -
 41
41 -
 42
42 -
 43
43 -
 44
44 -
 45
45 -
 46
46 -
 47
47 -
 48
48 -
 49
49 -
50
-
51
-
52
-
53
-
54
-
55
-
56
-
57
-
58
-
59
-
60
-
61
 |
 |

Part II, Item 8
MSFT 2003 FORM 10-K
26 /
reduction to OCI of $112 million ($75 million after-tax). The reduction to income was mostly attributable to a loss of approximately $300 million reclassified from
OCI for the time value of options and a loss of approximately $250 million reclassified from OCI for derivatives not designated as hedging instruments. The
reduction to OCI was mostly attributable to losses of approximately $670 million on cash flow hedges offset by reclassifications out of OCI of the approximately
$300 million loss for the time value of options and the approximately $250 million loss for derivative instruments not designated as hedging instruments. The net
derivative losses included in OCI as of July 1, 2000 were reclassified into earnings during the twelve months ended June 30, 2001. The change in accounting from
the adoption of SFAS 133 did not materially affect net income in 2001.
Effective July 1, 2001, we adopted SFAS 141, Business Combinations, and SFAS 142. SFAS 141 requires business combinations initiated after June 30, 2001
to be accounted for using the purchase method of accounting. It also specifies the types of acquired intangible assets that are required to be recognized and
reported separate from goodwill. SFAS 142 requires that goodwill and certain intangibles no longer be amortized, but instead tested for impairment at least
annually. There was no impairment of goodwill upon adoption of SFAS 142.
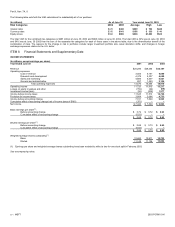
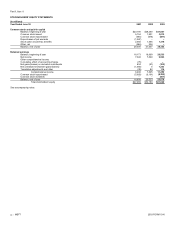
Net income and earnings per share for fiscal 2001 adjusted to exclude amortization expense (net of taxes) is as follows:
(In millions, except earnings per share)
Y
ear Ended June 30 2001
Net income:
Reported net income $7,346
Goodwill amortization 252
Equity method goodwill amortization 26
Adjusted net income $7,624
Basic earnings per share:
Reported basic earnings per share $ 0.69
Goodwill amortization 0.02
Equity method goodwill amortization
–
Adjusted basic earnings per share $ 0.71
Diluted earnings per share:
Reported diluted earnings per share $ 0.66
Goodwill amortization 0.02
Equity method goodwill amortization
–
Adjusted diluted earnings per share $ 0.68
Note 4—Unearned Revenue
Unearned revenue from volume licensing programs represents customer billings, paid either upfront or annually at the beginning of each billing coverage period,
which are accounted for as subscriptions with revenue recognized ratably over the billing coverage period. For certain other licensing arrangements revenue
attributable to undelivered elements, including free post-delivery telephone support and the right to receive unspecified upgrades/enhancements of Microsoft
Internet Explorer on a when-and-if-available basis, is based on the sales price of those elements when sold separately and is recognized ratably on a straight-line
basis over the related product’s life cycle. The percentage of revenue recorded as unearned due to undelivered elements ranges from approximately 15% to 25%
of the sales price for Windows XP Home, approximately 5% to 15% of the sales price for Windows XP Professional, and approximately 5% to 15% of the sales
price for desktop applications, depending on the terms and conditions of the license and prices of the elements. Product life cycles are currently estimated at three
and a half years for Windows operating systems and two years for desktop applications. Unearned revenue also includes payments for online advertising for which
the advertisement has yet to be displayed and payments for post-delivery support services to be performed in the future.
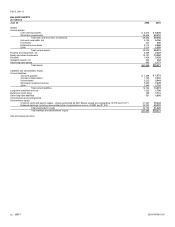
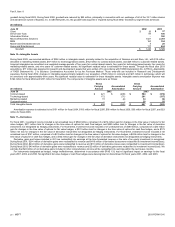
The components of unearned revenue were as follows:
(In millions)
June 30 2002 2003
Volume licensing programs $ 4,158 $ 5,472
Undelivered elements 2,830 2,847
Other 755 696
Unearned revenue $ 7,743 $ 9,015
Unearned revenue by segment was as follows:
(In millions)
June 30 2002 2003
Client $ 3,023 $ 3,165
Server and Tools 1,595 2,185
Information Worker 2,757 3,305
Other segments 368 360
Unearned revenue $ 7,743 $ 9,015