Microsoft 2003 Annual Report Download - page 34
Download and view the complete annual report
Please find page 34 of the 2003 Microsoft annual report below. You can navigate through the pages in the report by either clicking on the pages listed below, or by using the keyword search tool below to find specific information within the annual report.-
 1
1 -
2
-
3
-
4
-
5
-
6
-
7
-
8
-
9
-
10
-
11
-
12
-
13
-
14
-
15
-
16
-
17
-
18
-
19
-
20
-
21
-
22
-
23
-
 24
24 -
 25
25 -
 26
26 -
 27
27 -
 28
28 -
 29
29 -
 30
30 -
 31
31 -
 32
32 -
 33
33 -
 34
34 -
 35
35 -
 36
36 -
 37
37 -
 38
38 -
 39
39 -
 40
40 -
 41
41 -
 42
42 -
 43
43 -
 44
44 -
45
-
46
-
47
-
48
-
49
-
50
-
51
-
52
-
53
-
54
-
55
-
56
-
57
-
58
-
59
-
60
-
61
 |
 |

Part II, Item 8
MSFT 2003 FORM 10-K
21 /
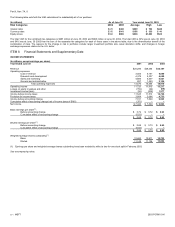
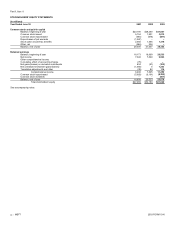
CASH FLOWS STATEMENTS
(In millions)
Year Ended June 30 2001 2002 2003
Operations
Net income $ 7,346 $ 7,829 $ 9,993
Cumulative effect of accounting change, net of tax 375 –
–
Depreciation, amortization, and other noncash items 1,536 1,084 1,439
Net recognized losses on investments 2,221 2,424 380
Stock option income tax benefits 2,066 1,596 1,376
Deferred income taxes (420) (416) 336
Unearned revenue 6,970 11,152 12,519
Recognition of unearned revenue (6,369) (8,929) (11,292)
Accounts receivable (418) (1,623) 187
Other current assets (482) (264) 412
Other long-term assets (330) (9) (28)
Other current liabilities 774 1,449 35
Other long-term liabilities 153 216 440
Net cash from operations 13,422 14,509 15,797
Financing
Common stock issued 1,620 1,497 2,120
Common stock repurchased (6,074) (6,069) (6,486)
Repurchases of put warrants (1,367) –
–
Common stock dividends – – (857)
Other, net 235 –
–
Net cash used for financing (5,586) (4,572) (5,223)
Investing
Additions to property and equipment (1,103) (770) (891)
Acquisitions of companies, net of cash acquired – – (1,063)
Purchases of investments (66,346) (89,386) (89,621)
Maturities of investments 5,867 8,654 9,205
Sales of investments 52,848 70,657 75,157
Net cash used for investing (8,734) (10,845) (7,213)
Net change in cash and equivalents (898) (908) 3,361
Effect of exchange rates on cash and equivalents (26) 2 61
Cash and equivalents, beginning of year 4,846 3,922 3,016
Cash and equivalents, end of year $ 3,922 $ 3,016 $ 6,438
See accompanying notes.