Microsoft 2003 Annual Report Download - page 26
Download and view the complete annual report
Please find page 26 of the 2003 Microsoft annual report below. You can navigate through the pages in the report by either clicking on the pages listed below, or by using the keyword search tool below to find specific information within the annual report.-
 1
1 -
2
-
3
-
4
-
5
-
6
-
7
-
8
-
9
-
10
-
11
-
12
-
13
-
14
-
15
-
 16
16 -
 17
17 -
 18
18 -
 19
19 -
 20
20 -
 21
21 -
 22
22 -
 23
23 -
 24
24 -
 25
25 -
 26
26 -
 27
27 -
 28
28 -
 29
29 -
 30
30 -
 31
31 -
 32
32 -
 33
33 -
 34
34 -
 35
35 -
 36
36 -
37
-
38
-
39
-
40
-
41
-
42
-
43
-
44
-
45
-
46
-
47
-
48
-
49
-
50
-
51
-
52
-
53
-
54
-
55
-
56
-
57
-
58
-
59
-
60
-
61
 |
 |

Part II, Item 7,
MSFT 2003 FORM 10-K
13 /
Sales and Marketing
Sales and marketing expenses include payroll, employee benefits, and other headcount-related costs associated with sales and marketing personnel and
advertising, promotions, tradeshows, seminars, and other programs. Sales and marketing expense as a percentage of revenue was 19.3% in 2001, 19.1% in
2002, and 20.3% in 2003. Sales and marketing expenses were $6.52 billion in 2003, compared to $5.41 billion in fiscal 2002. The increase in absolute dollars was
due to a 20% increase in sales expenses related to headcount additions, principally related to the Enterprise and Small/Medium Business sales forces, and a 21%
increase in marketing expenses.
In fiscal 2002, sales and marketing expenses were $5.41 billion, an increase of 11% from fiscal 2001. The sales and marketing expenses in absolute dollars
increased due to a 20% increase in headcount-related costs partially offset by a 25% decline in MSN customer acquisition marketing costs and a 4% decline in all
other marketing costs. In fiscal 2001, sales and marketing expenses were $4.89 billion compared to $4.13 billion in fiscal 2000. The 18% increase in sales and
marketing from fiscal 2000 was primarily due to a 21% growth in headcount-related costs, and to a lesser extent, a 3% growth in higher marketing and sales
expenses associated with MSN and other new sales initiatives.
General and Administrative
General and administrative costs include payroll, employee benefits, and other headcount-related costs associated with the finance, legal, facilities, certain human
resources, other administrative headcount, and legal and other administrative fees. General and administrative costs in fiscal 2003 increased $554 million due to a
charge of $750 million related to a settlement with AOL/Time Warner in the fourth quarter of 2003 and also due to a $256 million charge reflecting an increase in
our estimate of costs related to resolving pending state antitrust and unfair competition consumer class action lawsuits. General and administrative expenses in
fiscal 2002 increased due to a charge of approximately $660 million for estimated expenses related to resolving pending state antitrust and unfair competition
consumer class action lawsuits and a 10% increase in headcount-related costs. In fiscal 2001, general and administrative costs decreased due to a lawsuit
settlement charge recorded in fiscal 2000, partially offset by a 3% growth in headcount-related costs.
NON-OPERATING ITEMS, INVESTMENT INCOME/(LOSS), AND INCOME TAXES
Non-operating items
Losses on equity investees and other consist of our share of income or loss from investments accounted for using the equity method, and income or loss
attributable to minority interests. The decrease in losses on equity investees and other in fiscal 2003 and 2002 was due to the divestiture of certain equity
investments in fiscal 2002 in conjunction with the underlying performance of such entities. The increase in losses on equity investees and other in fiscal 2001
reflected an increase in the number of such investments during the year.
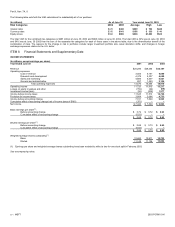
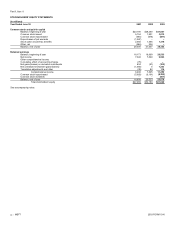
Investment Income/(Loss)
We recorded net investment income/(loss) in each year as follows:
(In millions)
Y
ear Ended June 30 2001 2002 2003
Dividends $ 377 $ 357 $ 260
Interest 1,808 1,762 1,697
Net recognized gains/(losses) on investments:
Net gains on the sales of investments 3,175 2,379 909
Other-than-temporary impairments (4,804) (4,323) (1,148)
Net unrealized losses attributable to derivative instruments (592) (480) (141)
Net recognized gains/(losses) on investments (2,221) (2,424) (380)
Investment income/(loss) $ (36) $ (305) $1,577
Investments are considered to be impaired when a decline in fair value is judged to be other-than-temporary. We employ a systematic methodology that considers
available evidence in evaluating potential impairment of our investments. If the cost of an investment exceeds its fair value, we evaluate, among other factors,
general market conditions, the duration and extent to which the fair value is less than cost, as well as our intent and ability to hold the investment. We also
consider specific adverse conditions related to the financial health of and business outlook for the investee, including industry and sector performance, changes in
technology, operational and financing cash flow factors, and rating agency actions. Once a decline in fair value is determined to be other-than-temporary, an
impairment charge is recorded and a new cost basis in the investment is established.
In fiscal 2003, other-than-temporary impairments decreased mainly due to the lack of significant continued impairments in the cable and telecommunications
sectors. Interest income decreased $65 million due to declining interest rates partially offset by a larger investment portfolio. Dividend income decreased $97
million primarily related to the exchange of AT&T 5% convertible preferred debt for common shares of AT&T Corporation during the year.
In fiscal 2002, other-than-temporary impairments primarily related to our investment in AT&T and other cable and telecommunication investments. Net gains on
the sales of investments included a $1.25 billion gain on sale of our share of Expedia. Interest and dividend income decreased $66 million from fiscal 2001 as a
result of lower interest rates and dividend income.
In fiscal 2001, other-than-temporary impairments primarily related to cable and telecommunication investments. Net gains from the sales of investments in
fiscal 2001 included a gain from our investment in Titus Communications (which was merged with Jupiter Telecommunications) and the closing of the sale of
Transpoint to CheckFree Holdings Corp. Interest and dividend income increased $591 million from fiscal 2000, reflecting a larger investment portfolio.