Microsoft 2003 Annual Report Download - page 51
Download and view the complete annual report
Please find page 51 of the 2003 Microsoft annual report below. You can navigate through the pages in the report by either clicking on the pages listed below, or by using the keyword search tool below to find specific information within the annual report.-
 1
1 -
2
-
3
-
4
-
5
-
6
-
7
-
8
-
9
-
10
-
11
-
12
-
13
-
14
-
15
-
16
-
17
-
18
-
19
-
20
-
21
-
22
-
23
-
24
-
25
-
26
-
27
-
28
-
29
-
30
-
31
-
32
-
33
-
34
-
35
-
36
-
37
-
38
-
39
-
40
-
 41
41 -
 42
42 -
 43
43 -
 44
44 -
 45
45 -
 46
46 -
 47
47 -
 48
48 -
 49
49 -
 50
50 -
 51
51 -
 52
52 -
 53
53 -
 54
54 -
 55
55 -
 56
56 -
 57
57 -
 58
58 -
 59
59 -
 60
60 -
 61
61
 |
 |
Part II, Item 8
MSFT 2003 FORM 10-K
38 /
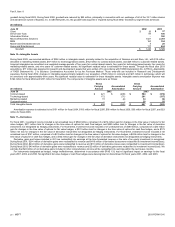
impracticable for the Company to separately identify the amount of amortization and depreciation by segment that is included in the measure of segment profit or
loss.
On July 1, 2002, we revised our segments. These changes are designed to promote better alignment of strategies and objectives between development, sales,
marketing, and services organizations; provide for more timely and rational allocation of development, sales, and marketing resources within businesses; and
focus long-term planning efforts on key objectives and initiatives. Our seven new segments are: Client; Server and Tools; Information Worker; Microsoft Business
Solutions; MSN; Mobile and Embedded Devices; and Home and Entertainment. Prior year segment information has been restated to conform to the seven new
segments. It is not practical to discern operating income for 2001 for the current segments or operating income for 2003 for the previous segments due to
reorganizations.
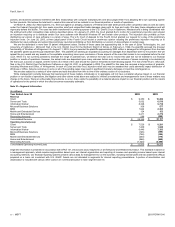
The segments are designed to allocate resources internally and provide a framework to determine management responsibility. Due to our integrated business
structure, operating costs included in one segment may benefit other segments, and therefore these segments are not designed to measure operating income or
loss directly related to the products included in each segment. Inter-segment cost commissions are estimated by management and used to compensate or charge
each segment for such shared costs and to incent shared efforts. Management will continually evaluate the alignment of development, sales organizations, and
inter-segment commissions for segment reporting purposes, which may result in changes to segment allocations in future periods.
The Client segment includes revenue and operating expenses associated with Windows XP, Windows 2000, and other standard Windows operating systems.
Server and Tools segment consists of revenue and operating expenses associated with server software licenses and client access licenses (CALs) for Windows
Server, SQL Server, Exchange Server, and other servers. It also includes developer tools, training, certification, Microsoft Press, Premier product support services,
and Microsoft consulting services. Information Worker segment includes Microsoft Office, Microsoft Project, Visio, other information worker products, SharePoint
Portal Server CALs, an allocation for CALs, and professional product support services. Microsoft Business Solutions includes Microsoft Great Plains, Navision, and
bCentral. MSN includes MSN Subscription and MSN Network services. Mobile and Embedded Devices includes Windows Mobile software, Windows Embedded
device operating systems, MapPoint, and Windows Automotive. Home and Entertainment includes the Xbox video game system, PC games, consumer software
and hardware, and TV platform.
Reconciling amounts include adjustments to state revenue and operating income in accordance with U.S. GAAP and corporate level expenses not specifically
attributed to a segment. For revenue, reconciling items include certain undelivered elements of unearned revenue and allowances for certain sales returns and
rebates. Reconciling items for operating income/(loss) include general and administrative expenses ($1.55 billion in 2002 and $2.10 billion in 2003), broad-based
research and development expenses ($202 million in 2002 and $210 million in 2003), and certain corporate level sales and marketing costs ($526 million in 2002
and $688 million in 2003). The internal segment operating income or loss also includes non-GAAP accelerated methods of depreciation and amortization.
Additionally, losses on equity investees and minority interest are classified in operating income for internal reporting presentations.
Revenue attributable to U.S. operations includes shipments to customers in the United States, licensing to OEMs and certain multinational organizations, and
exports of finished goods, primarily to Asia, Latin America, and Canada. Revenue from U.S. operations totaled $17.8 billion, $20.9 billion, and $22.1 billion in 2001,
2002, and 2003. Revenue from outside the United States, excluding licensing to OEMs and certain multinational organizations and U.S. exports, totaled $7.5
billion, $7.5 billion, and $10.1 billion in 2001, 2002, and 2003. No single customer accounted for 10% or more of revenue in 2001, 2002, or 2003.
Long-lived assets (principally property and equipment) totaled $2.0 billion and $1.9 billion in the United States in 2002 and 2003 and $220 million, and $294
million in other countries in 2002 and 2003.