Sony 2009 Annual Report Download - page 36
Download and view the complete annual report
Please find page 36 of the 2009 Sony annual report below. You can navigate through the pages in the report by either clicking on the pages listed below, or by using the keyword search tool below to find specific information within the annual report.-
 1
1 -
2
-
3
-
4
-
5
-
6
-
7
-
8
-
9
-
10
-
11
-
12
-
13
-
14
-
15
-
16
-
17
-
18
-
19
-
20
-
21
-
22
-
23
-
24
-
25
-
 26
26 -
 27
27 -
 28
28 -
 29
29 -
 30
30 -
 31
31 -
 32
32 -
 33
33 -
 34
34 -
 35
35 -
 36
36 -
 37
37 -
 38
38 -
 39
39 -
 40
40 -
 41
41 -
 42
42 -
 43
43 -
 44
44 -
 45
45 -
 46
46 -
47
-
48
-
49
-
50
-
51
-
52
 |
 |

34
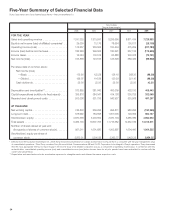
Five-Year Summary of Selected Financial Data
Sony Corporation and Consolidated Subsidiaries—Years ended March 31
Yen in millions
(Yen per share amounts)
2005 2006 2007 2008 2009
FOR THE YEAR
Sales and operating revenue . . . . . . . . . . . . . . . . .
7,191,325 7,510,597 8,295,695 8,871,414 7,729,993
Equity in net income (loss) of affiliated companies* . .
29,039 13,176 78,654 100,817 (25,109)
Operating income (loss) . . . . . . . . . . . . . . . . . . . . .
174,667 239,592 150,404 475,299 (227,783)
Income (loss) before income taxes . . . . . . . . . . . . .
186,246 299,506 180,691 567,134 (174,955)
Income taxes .............................
16,044 176,515 53,888 203,478 (72,741)
Net income (loss) ..........................
163,838 123,616 126,328 369,435 (98,938)
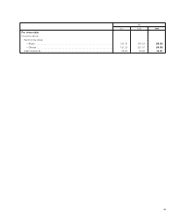
Per share data of common stock:
Net income (loss)
—Basic ............................
175.90 122.58 126.15 368.33 (98.59)
—Diluted ...........................
158.07 116.88 120.29 351.10 (98.59)
Cash dividends ........................
25.00 25.00 25.00 25.00 42.50
Depreciation and amortization** ................
372,865 381,843 400,009 428,010 405,443
Capital expenditures (addition to fixed assets) . . . .
356,818 384,347 414,138 335,726 332,068
Research and development costs . . . . . . . . . . . . .
502,008 531,795 543,937 520,568 497,297
AT YEAR-END
Net working capital .........................
746,803 569,296 994,871 986,296 (190,265)
Long-term debt ...........................
678,992 764,898 1,001,005 729,059 660,147
Stockholders’ equity ........................
2,870,338 3,203,852 3,370,704 3,465,089 2,964,653
Total assets ..............................
9,499,100 10,607,753 11,716,362 12,552,739 12,013,511
Number of shares issued at year-end
(thousands of shares of common stock) . . . . . . .
997,211 1,001,680 1,002,897 1,004,443 1,004,535
Stockholders’ equity per share of
common stock ..........................
2,872.21 3,200.85 3,363.77 3,453.25 2,954.25
* Effective from the fiscal year ended March 31, 2009, Sony revised the presentation of its financial information to ensure that it is consistent with the way management views
its consolidated operations. Since Sony considers Sony Ericsson Mobile Communications AB and S-LCD Corporation to be integral to Sony’s operations, Sony determined
that the most appropriate method to report equity in net income (loss) of all affiliated companies was as a component of operating income (loss). In connection with this
reclassification, consolidated operating income (loss) and consolidated income (loss) before income taxes for all prior periods have been reclassified to conform with the
current year presentation.
** Depreciation and amortization includes amortization expenses for intangible assets and deferred insurance acquisition costs.