Sony 2009 Annual Report Download - page 6
Download and view the complete annual report
Please find page 6 of the 2009 Sony annual report below. You can navigate through the pages in the report by either clicking on the pages listed below, or by using the keyword search tool below to find specific information within the annual report.-
 1
1 -
 2
2 -
 3
3 -
 4
4 -
 5
5 -
 6
6 -
 7
7 -
 8
8 -
 9
9 -
 10
10 -
 11
11 -
 12
12 -
 13
13 -
 14
14 -
 15
15 -
 16
16 -
 17
17 -
18
-
19
-
20
-
21
-
22
-
23
-
24
-
25
-
26
-
27
-
28
-
29
-
30
-
31
-
32
-
33
-
34
-
35
-
36
-
37
-
38
-
39
-
40
-
41
-
42
-
43
-
44
-
45
-
46
-
47
-
48
-
49
-
50
-
51
-
52
 |
 |

4
Electronics
Game
Business Overview (Fiscal Year in Review)
Japan
U.S.A.
Europe
Other
*Year ended March 31
*Percentage of sales and
operating revenue to outside customers
*Year ended March 31
*Percentage of sales and operating revenue to outside
customers
*Sales and operating revenue accounted for by customers in
each particular region
23.6%
24.2%
25.7%
26.5%
2009
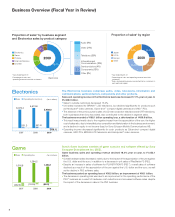
Proportion of sales* by business segment
and Electronics sales by product category
Proportion of sales* by region
12.7%
65.1%
9.3%
6.8%
6.1%
Audio (9%)
Electronics
Video (21%)
Televisions (25%)
Information and
Communications (19%)
Semiconductors (4%)
Components (13%)
Other (9%)
2009
The Electronics business comprises audio, video, televisions, information and
communications, semiconductors, components and other products.
Sales and operating revenue in the Electronics business decreased 17.0% year on year, to
¥5,488.0 billion.
Sales to outside customers decreased 15.2%.
Unit sales increased for BRAVIA™ LCD televisions, but declined significantly for products such
as Handycam® video cameras, Cyber-shot™ compact digital cameras and VAIO™ PCs.
The absence of the previous year’s sales of LCD rear-projection televisions and CRT televisions,
both businesses that Sony has exited, also contributed to the decline in segment sales.
The business recorded a ¥168.1 billion operating loss, a deterioration of ¥609.9 billion.
This result was primarily due to the negative impact from the appreciation of the yen; the higher
cost of sales ratio, due to intensified price competition and deterioration in the business environment;
and a decline in equity in net income (loss) for Sony Ericsson Mobile Communications AB.
Operating income decreased significantly for such products as Cyber-shot compact digital
cameras, VAIO PCs, BRAVIA LCD televisions and Handycam® video cameras.
Sony’s Game business consists of game consoles and software offered by Sony
Computer Entertainment Inc. (SCE).
Game business sales and operating revenue declined 18.0% year on year, to ¥1,053.1
billion.
Overall hardware sales decreased, mainly due to the impact of the appreciation of the yen against
the U.S. dollar and the euro, in addition to a decrease in unit sales of PlayStation®2 (PS2).
Despite an increase in sales of software for PLAYSTATION®3 (PS3™), overall sales of software
declined as a result of the appreciation of the yen against the U.S. dollar and the euro, as well
as the decline in PS2 software sales.
The business posted an operating loss of ¥58.5 billion, an improvement of ¥66.1 billion.
The decrease in operating loss was due to an improvement in the operating performance of the
PS3™ business as a result of hardware cost reductions and increased software sales despite
the impact of the decrease in sales in the PS2 business.
6,072.4 6,613.8
441.8
251.3
5,488.0
(168.1)
(Yen in billions)
2007 2008 2009
1,016.8
1,284.2
1,053.1
(232.3) (124.5) (58.5)
(Yen in billions)
2007 2008 2009
Sales Operating income (loss)
Sales Operating loss
Electronics
Game
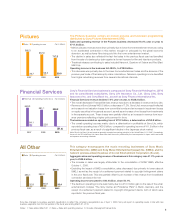
Pictures
Financial Services
All Other