Sony 2009 Annual Report Download - page 39
Download and view the complete annual report
Please find page 39 of the 2009 Sony annual report below. You can navigate through the pages in the report by either clicking on the pages listed below, or by using the keyword search tool below to find specific information within the annual report.-
 1
1 -
2
-
3
-
4
-
5
-
6
-
7
-
8
-
9
-
10
-
11
-
12
-
13
-
14
-
15
-
16
-
17
-
18
-
19
-
20
-
21
-
22
-
23
-
24
-
25
-
26
-
27
-
28
-
 29
29 -
 30
30 -
 31
31 -
 32
32 -
 33
33 -
 34
34 -
 35
35 -
 36
36 -
 37
37 -
 38
38 -
 39
39 -
 40
40 -
 41
41 -
 42
42 -
 43
43 -
 44
44 -
 45
45 -
 46
46 -
 47
47 -
 48
48 -
 49
49 -
50
-
51
-
52
 |
 |

37
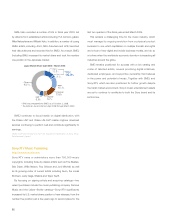
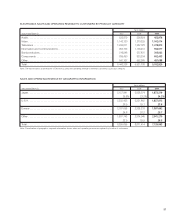
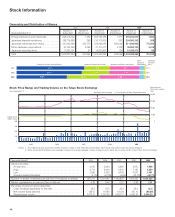
ELECTRONICS SALES AND OPERATING REVENUE TO CUSTOMERS BY PRODUCT CATEGORY
Yen in millions
Years ended March 31 2007 2008 2009
Audio ............................................................
522,879 558,624 453,976
Video ............................................................
1,143,120 1,279,225 1,042,014
Televisions ........................................................
1,226,971 1,367,078 1,275,810
Information and Communications .......................................
954,163 1,103,212 942,517
Semiconductors ....................................................
219,546 237,870 205,062
Components ......................................................
835,490 833,334 662,453
Other ............................................................
541,167 552,365 451,088
Total .............................................................
5,443,336 5,931,708 5,032,920
Note: The above table is a breakdown of Electronics sales and operating revenue to external customers by product category.
SALES AND OPERATING REVENUE BY GEOGRAPHIC INFORMATION
Yen in millions
Years ended March 31 2007 2008 2009
Japan ............................................................
2,127,841 2,056,374 1,873,219
........................................................................ 25.6% 23.2% 24.2%
U.S.A. ...........................................................
2,232,453 2,221,862 1,827,812
........................................................................ 26.9 25.1 23.6
Europe ...........................................................
2,037,658 2,328,233 1,987,692
........................................................................ 24.6 26.2 25.7
Other ............................................................
1,897,743 2,264,945 2,041,270
........................................................................ 22.9 25.5 26.5
Total .............................................................
8,295,695 8,871,414 7,729,993
Note: Classification of geographic segment information shows sales and operating revenue recognized by location of customers.