Sony 2009 Annual Report Download - page 42
Download and view the complete annual report
Please find page 42 of the 2009 Sony annual report below. You can navigate through the pages in the report by either clicking on the pages listed below, or by using the keyword search tool below to find specific information within the annual report.-
 1
1 -
2
-
3
-
4
-
5
-
6
-
7
-
8
-
9
-
10
-
11
-
12
-
13
-
14
-
15
-
16
-
17
-
18
-
19
-
20
-
21
-
22
-
23
-
24
-
25
-
26
-
27
-
28
-
29
-
30
-
31
-
 32
32 -
 33
33 -
 34
34 -
 35
35 -
 36
36 -
 37
37 -
 38
38 -
 39
39 -
 40
40 -
 41
41 -
 42
42 -
 43
43 -
 44
44 -
 45
45 -
 46
46 -
 47
47 -
 48
48 -
 49
49 -
 50
50 -
 51
51 -
 52
52
 |
 |

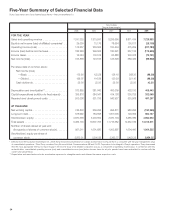
40
Yen in millions
2007 2008 2009
Sales and operating revenue:
Net sales .........................................................
7,567,359 8,201,839 7,110,053
Financial service revenue .............................................
624,282 553,216 523,307
Other operating revenue ..............................................
104,054 116,359 96,633
...............................................................
8,295,695 8,871,414 7,729,993
Costs and expenses:
Cost of sales ......................................................
5,889,601 6,290,022 5,660,504
Selling, general and administrative . . . . . . . . . . . . . . . . . . . . . . . . . . . . . . . . . . . . . .
1,788,427 1,714,445 1,686,030
Financial service expenses ............................................
540,097 530,306 547,825
(Gain) loss on sale, disposal or impairment of assets, net .....................
5,820 (37,841) 38,308
...............................................................
8,223,945 8,496,932 7,932,667
Equity in net income (loss) of affiliated companies .......................
78,654 100,817 (25,109)
Operating income (loss) ............................................
150,404 475,299 (227,783)
Other income:
Interest and dividends ...............................................
28,240 34,272 22,317
Foreign exchange gain, net ...........................................
— 5,571 48,568
Gain on sale of securities investments, net ................................
14,695 5,504 1,281
Gain on change in interest in subsidiaries and equity investees .................
31,509 82,055 1,882
Other ............................................................
20,738 22,045 24,777
...............................................................
95,182 149,447 98,825
Other expenses:
Interest ...........................................................
27,278 22,931 24,376
Loss on devaluation of securities investments . . . . . . . . . . . . . . . . . . . . . . . . . . . . .
1,308 13,087 4,427
Foreign exchange loss, net ............................................
18,835 — —
Other ............................................................
17,474 21,594 17,194
...............................................................
64,895 57,612 45,997
Income (loss) before income taxes and minority interest ..................
180,691 567,134 (174,955)
Income taxes:
Current ...........................................................
67,081 183,438 80,521
Deferred ..........................................................
(13,193) 20,040 (153,262)
...............................................................
53,888 203,478 (72,741)
Income (loss) before minority interest ..................................
126,803 363,656 (102,214)
Minority interest in income (loss) of consolidated subsidiaries ..................
475 (5,779) (3,276)
Net income (loss)
...................................................
126,328 369,435 (98,938)
(Continued on following page)
Consolidated Statements of Income
Sony Corporation and Consolidated Subsidiaries—Years ended March 31