Sony 2009 Annual Report Download - page 48
Download and view the complete annual report
Please find page 48 of the 2009 Sony annual report below. You can navigate through the pages in the report by either clicking on the pages listed below, or by using the keyword search tool below to find specific information within the annual report.-
 1
1 -
2
-
3
-
4
-
5
-
6
-
7
-
8
-
9
-
10
-
11
-
12
-
13
-
14
-
15
-
16
-
17
-
18
-
19
-
20
-
21
-
22
-
23
-
24
-
25
-
26
-
27
-
28
-
29
-
30
-
31
-
32
-
33
-
34
-
35
-
36
-
37
-
 38
38 -
 39
39 -
 40
40 -
 41
41 -
 42
42 -
 43
43 -
 44
44 -
 45
45 -
 46
46 -
 47
47 -
 48
48 -
 49
49 -
 50
50 -
 51
51 -
 52
52
 |
 |
46
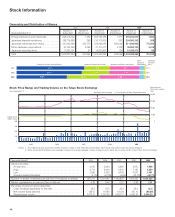
Stock Price Range and Trading Volume on the Tokyo Stock Exchange
Years ended March 31
20062005 2007 2008 2009
400
300
200
100
0
20,000
15,000
10,000
5,000
0
Notes: 1. This trading volume shows the monthly volume of trade on the Tokyo Stock Exchange. Each fiscal year starts in April and ends in March.
2. Stock prices and the Nikkei stock average is based on a simple average of daily closing prices for each day of every month on the Tokyo Stock Exchange.
Trading volume
(Million shares)
Stock price and
Nikkei stock average
(Yen)
Nikkei stock average Closing price of Sony Corporation stock
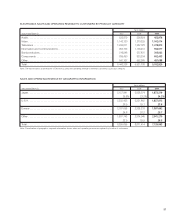
Ownership and Distribution of Shares
2007 2008 2009
Number of Number of Number of Number of Number of Number of
Years ended March 31 shares held shareholders shares held shareholders shares held shareholders
Foreign institutions and individuals .........
528,218,332 1,380 508,166,485 1,371 391,610,510 1,394
Japanese financial institutions ............
198,775,896 269 216,107,606 297 254,990,242 269
Japanese individuals and others ...........
231,442,469 624,770 234,246,294 633,045 311,694,942 775,092
Other Japanese corporations .............
33,163,266 4,054 31,101,417 4,108 35,954,100 4,419
Japanese securities firms ................
11,297,301 81 14,821,562 124 10,285,570 68
Total ................................
1,002,897,264 630,554 1,004,443,364 638,945 1,004,535,364 761,242
Stock Information
Years ended March 31 2005 2006 2007 2008 2009
Stock price (Yen)
At year-end ...........................................
4,270 5,450 5,990 3,970 1,998
High ................................................
4,710 6,040 6,540 7,190 5,560
Low ................................................
3,550 3,660 4,340 3,910 1,491
Annual increase/decrease ................................
–2.1% +27.6% +9.9% –33.7% –49.7%
Number of shares outstanding at year-end (Thousands of shares) ...
997,211 1,001,680 1,002,897 1,004,443 1,004,535
Market capitalization at year-end (Yen in trillions). . . . . . . . . . . . . . . . .
4.26 5.46 6.01 3.99 2.01
Per share of common stock data (Yen)
Cash dividends applicable to the year .......................
25.0 25.0 25.0 25.0 42.5
Net income (loss) (diluted) ................................
158.07 116.88 120.29 351.10 (98.59)
Stockholders’ equity ....................................
2,872.21 3,200.85 3,363.77 3,453.25 2,954.25
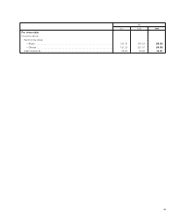
2007
2008
2009 39.0% 25.4% 31.0% 3.6% 1.0%
52.7% 19.8% 23.1% 3.3% 1.1%
50.6% 21.5% 23.3% 3.1% 1.5%
Japanese individuals and others Japanese financial institutionsForeign institutions and individuals
Other
Japanese
corporations
Japanese
securities
firms