Sony 2009 Annual Report Download - page 7
Download and view the complete annual report
Please find page 7 of the 2009 Sony annual report below. You can navigate through the pages in the report by either clicking on the pages listed below, or by using the keyword search tool below to find specific information within the annual report.-
 1
1 -
 2
2 -
 3
3 -
 4
4 -
 5
5 -
 6
6 -
 7
7 -
 8
8 -
 9
9 -
 10
10 -
 11
11 -
 12
12 -
 13
13 -
 14
14 -
 15
15 -
 16
16 -
 17
17 -
 18
18 -
19
-
20
-
21
-
22
-
23
-
24
-
25
-
26
-
27
-
28
-
29
-
30
-
31
-
32
-
33
-
34
-
35
-
36
-
37
-
38
-
39
-
40
-
41
-
42
-
43
-
44
-
45
-
46
-
47
-
48
-
49
-
50
-
51
-
52
 |
 |

5
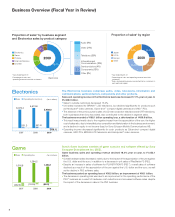
This category encompasses the music recording businesses of Sony Music
Entertainment Inc. (SME) and Sony Music Entertainment (Japan) Inc. (SMEJ), and the
network services-related business of So-net Entertainment Corporation (So-net).
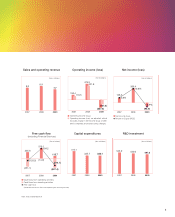
Aggregate sales and operating revenue of businesses in this category rose 41.2% year on
year, to ¥539.6 billion.
The increase in sales was largely attributable to the consolidation of SONY BMG, effective
October 1, 2008.
Excluding the impact of SME’s consolidation, sales decreased, due primarily to lower sales at
SMEJ, as well as the receipt of a settlement payment related to copyright infringement claims
in the prior fiscal year. This was partially offset by an increase of fee revenue from broadband
connection services at So-net.
Operating income amounted to ¥30.4 billion, down 50.1%.
The decline in operating income was mainly due to a ¥10.0 billion gain on the sale of the urban
entertainment complex “The Sony Center am Potsdamer Platz” in Berlin, Germany, and the
receipt of a settlement payment related to copyright infringement claims, both of which were
reported in the previous fiscal year.
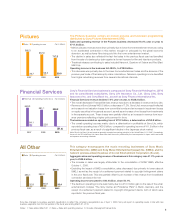
Pictures
Financial Services
All Other
The Pictures business centers on motion pictures and television programming
distributed by Sony Pictures Entertainment (SPE).
Sales and operating revenue in the Pictures business decreased 16.4% year on year, to
¥717.5 billion.
Motion pictures revenues were down primarily due to lower home entertainment revenues owing
to an accelerated contraction in this market, brought on principally by the global economic
downturn, as well as fewer films being sold into the home entertainment market.
The decline in sales also reflected the fact that sales in the previous fiscal year had benefited
from the sale of a bankruptcy claim against a former licensee for film and television products.
Theatrical releases contributing to sales included Hancock, Quantum of Solace and Paul Blart:
Mall Cop.
Operating income in the business fell 48.9%, to ¥29.9 billion.
This decrease was primarily due to the lower home entertainment sales and the absence of the
previous year’s sale of the bankruptcy claim noted above. Television operating income benefited
from higher advertising revenues from several international channels.
Sony’s Financial Services business is composed of Sony Financial Holdings Inc. (SFH)
and its consolidated subsidiaries, Sony Life Insurance Co., Ltd. (Sony Life), Sony
Assurance Inc. and Sony Bank Inc., as well as Sony Finance International Inc.
Financial Services revenue declined 7.4% year on year, to ¥538.2 billion.
The overall decrease in Financial Services revenue was due to a decrease in revenue at Sony Life.
Revenue at Sony Life was ¥430.5 billion, a decrease of 7.2%. Sony Life’s revenue result reflected
an increase in net valuation losses from convertible bonds and an increase in impairment losses
on equity securities in the general account, as well as an increase of net losses from investments
in the separate account. These losses were partially offset by an increase in revenue from insur-
ance premiums reflecting a higher policy amount in force.
The business recorded an operating loss of ¥31.2 billion, a deterioration of ¥53.8 billion.
The overall operating loss was mainly due to a deterioration in profitability at Sony Life, which
reported an operating loss of ¥29.8 billion, compared to operating income of ¥11.5 billion in the
previous fiscal year, as a result of a significant decline in the Japanese stock market.
Note: Results for Sony Life are based on generally accepted accounting principles in the United States (U.S. GAAP). Accordingly,
the results for SFH and Sony Life shown here differ from the results published by the two companies in Japan, which are based
on Japanese accounting standards.
Sony has changed its business segment classification to reflect the company’s reorganization as of April 1, 2009. Sony will report its operating results in line with new
business segments from the first quarter of the fiscal year ending March 31, 2010.
Notes: 1. Years ended March 31 2. Sales = Sales and operating revenue 3. Includes intersegment transactions
966.3
857.9
717.5
26.7 58.5 29.9
(Yen in billions)
2007 2008 2009
649.3
538.2
84.1
581.1
22.6
(31.2)
(Yen in billions)
2007 2008 2009
355.1 382.2
539.6
32.8 60.8 30.4
(Yen in billions)
2007 2008 2009
Sales Operating income
Revenue Operating income (loss)
Sales Operating income