Sony 2009 Annual Report Download - page 38
Download and view the complete annual report
Please find page 38 of the 2009 Sony annual report below. You can navigate through the pages in the report by either clicking on the pages listed below, or by using the keyword search tool below to find specific information within the annual report.-
 1
1 -
2
-
3
-
4
-
5
-
6
-
7
-
8
-
9
-
10
-
11
-
12
-
13
-
14
-
15
-
16
-
17
-
18
-
19
-
20
-
21
-
22
-
23
-
24
-
25
-
26
-
27
-
 28
28 -
 29
29 -
 30
30 -
 31
31 -
 32
32 -
 33
33 -
 34
34 -
 35
35 -
 36
36 -
 37
37 -
 38
38 -
 39
39 -
 40
40 -
 41
41 -
 42
42 -
 43
43 -
 44
44 -
 45
45 -
 46
46 -
 47
47 -
 48
48 -
49
-
50
-
51
-
52
 |
 |

36
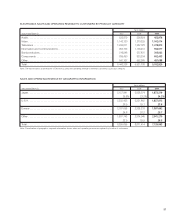
SALES AND OPERATING REVENUE BY BUSINESS SEGMENT*
Yen in millions
Years ended March 31 2007 2008 2009
Electronics
Customers ......................................................
5,443,336 5,931,708 5,032,920
Intersegment .....................................................
629,042 682,102 455,035
Total ...........................................................
6,072,378 6,613,810 5,487,955
Game
Customers ......................................................
974,218 1,219,004 984,855
Intersegment .....................................................
42,571 65,239 68,291
Total ...........................................................
1,016,789 1,284,243 1,053,146
Pictures
Customers ......................................................
966,260 855,482 717,513
Intersegment .....................................................
— 2,452 —
Total ...........................................................
966,260 857,934 717,513
Financial Services
Customers ......................................................
624,282 553,216 523,307
Intersegment .....................................................
25,059 27,905 14,899
Total ...........................................................
649,341 581,121 538,206
All Other
Customers ......................................................
287,599 312,004 471,398
Intersegment .....................................................
67,525 70,194 68,205
Total ...........................................................
355,124 382,198 539,603
Elimination ........................................................
(764,197) (847,892) (606,430)
Consolidated total ..................................................
8,295,695 8,871,414 7,729,993
* Electronics intersegment amounts primarily consist of transactions with the Game segment, Pictures segment and All Other. Game intersegment amounts primarily consist
of transactions with the Electronics segment. All Other intersegment amounts primarily consist of transactions with the Electronics, Game and Picture segments.
Segment Information
Sony Corporation and Consolidated Subsidiaries—Years ended March 31
OPERATING INCOME (LOSS) BY BUSINESS SEGMENT*
Yen in millions
Years ended March 31 2007 2008 2009
Electronics ........................................................
251,256 441,787 (168,084)
Game ............................................................
(232,325) (124,526) (58,476)
Pictures ..........................................................
26,705 58,524 29,916
Financial Services ...................................................
84,142 22,633 (31,157)
All Other ..........................................................
32,808 60,800 30,367
Total .............................................................
162,586 459,218 (197,434)
Corporate and elimination ............................................
(12,182) 16,081 (30,349)
Consolidated total ..................................................
150,404 475,299 (227,783)
* Operating income (loss) is sales and operating revenue less costs and expenses, and includes equity in net income (loss) of affiliated companies.