Sony 2009 Annual Report Download - page 5
Download and view the complete annual report
Please find page 5 of the 2009 Sony annual report below. You can navigate through the pages in the report by either clicking on the pages listed below, or by using the keyword search tool below to find specific information within the annual report.-
 1
1 -
 2
2 -
 3
3 -
 4
4 -
 5
5 -
 6
6 -
 7
7 -
 8
8 -
 9
9 -
 10
10 -
 11
11 -
 12
12 -
 13
13 -
 14
14 -
 15
15 -
 16
16 -
17
-
18
-
19
-
20
-
21
-
22
-
23
-
24
-
25
-
26
-
27
-
28
-
29
-
30
-
31
-
32
-
33
-
34
-
35
-
36
-
37
-
38
-
39
-
40
-
41
-
42
-
43
-
44
-
45
-
46
-
47
-
48
-
49
-
50
-
51
-
52
 |
 |

3
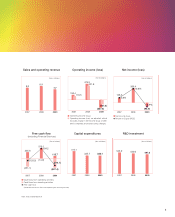
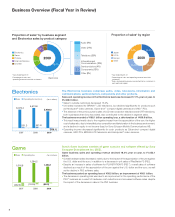
Sales and operating revenue
8.3 8.9
7.7
(Yen in trillions)
2007 2008 2009
Net income (loss)
126.3
3.8%
10.8%
-3.1%
369.4
(98.9)
(Yen in billions)
2007 2008 2009
Operating income (loss)
150.4110.5
475.3
421.8
(227.8)
(127.3)
(Yen in billions)
2007 2008 2009
Capital expenditures
414.1
335.7 332.1
(Yen in billions)
2007 2008 2009
Cash flows from operating activities
Cash flows from investing activities
Free cash flow
(Combined total of cash flows from operating and investing activities)
Free cash flow
(excluding Financial Services)
(125.5)
504.2
305.6
(431.1)
519.1
112.7
(487.4)
(14.9)
(374.7)
(Yen in billions)
2007 2008 2009
R&D investment
543.9 520.6 497.3
(Yen in billions)
2007 2008 2009
Net income (loss)
Return on Equity (ROE)
Operating income (loss)
Operating income (loss), as adjusted, which
excludes equity in net income (loss) of affili-
ated companies and restructuring charges
Note: Years ended March 31