Sony 2009 Annual Report Download - page 44
Download and view the complete annual report
Please find page 44 of the 2009 Sony annual report below. You can navigate through the pages in the report by either clicking on the pages listed below, or by using the keyword search tool below to find specific information within the annual report.-
 1
1 -
2
-
3
-
4
-
5
-
6
-
7
-
8
-
9
-
10
-
11
-
12
-
13
-
14
-
15
-
16
-
17
-
18
-
19
-
20
-
21
-
22
-
23
-
24
-
25
-
26
-
27
-
28
-
29
-
30
-
31
-
32
-
33
-
 34
34 -
 35
35 -
 36
36 -
 37
37 -
 38
38 -
 39
39 -
 40
40 -
 41
41 -
 42
42 -
 43
43 -
 44
44 -
 45
45 -
 46
46 -
 47
47 -
 48
48 -
 49
49 -
 50
50 -
 51
51 -
 52
52
 |
 |

42
Yen in millions
2007 2008 2009
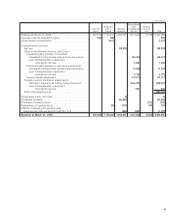
Cash flows from operating activities:
Net income (loss) .................................................
126,328 369,435 (98,938)
Adjustments to reconcile net income (loss) to net cash provided
by operating activities—
Depreciation and amortization, including amortization of deferred insurance
acquisition costs ...............................................
400,009 428,010 405,443
Amortization of film costs ..........................................
368,382 305,468 255,713
Stock-based compensation expense . . . . . . . . . . . . . . . . . . . . . . . . . . . . . . . .
3,838 4,130 3,446
Accrual for pension and severance costs, less payments . . . . . . . . . . . . . . . . .
(22,759) (17,589) 16,654
(Gain) loss on sale, disposal or impairment of assets, net . . . . . . . . . . . . . . . . .
5,820 (37,841) 38,308
(Gain) loss on sale or devaluation of securities investments, net . . . . . . . . . . . .
(13,387) 7,583 3,146
(Gain) loss on revaluation of marketable securities held in the financial service
business for trading purpose, net . . . . . . . . . . . . . . . . . . . . . . . . . . . . . . . . . .
(11,857) 56,543 77,952
Loss on revaluation or impairment of securities investments held
in the financial service business, net . . . . . . . . . . . . . . . . . . . . . . . . . . . . . . . .
208 60,107 101,114
Gain on change in interest in subsidiaries and equity investees . . . . . . . . . . . . .
(31,509) (82,055) (1,882)
Deferred income taxes ............................................
(13,193) 20,040 (153,262)
Equity in net (income) losses of affiliated companies, net of dividends . . . . . . . .
(68,179) (13,527) 65,470
Changes in assets and liabilities:
(Increase) decrease in notes and accounts receivable, trade . . . . . . . . . . . . .
(357,891) 185,651 218,168
(Increase) decrease in inventories ..................................
(119,202) (140,725) 160,432
Increase in film costs ...........................................
(320,079) (353,343) (264,412)
Increase (decrease) in notes and accounts payable, trade . . . . . . . . . . . . . . .
362,079 (235,459) (375,842)
Increase (decrease) in accrued income and other taxes . . . . . . . . . . . . . . . . .
(14,396) 138,872 (163,200)
Increase in future insurance policy benefits and other ...................
172,498 166,356 174,549
Increase in deferred insurance acquisition costs .......................
(61,563) (62,951) (68,666)
(Increase) decrease in marketable securities held in the financial service
business for trading purpose . . . . . . . . . . . . . . . . . . . . . . . . . . . . . . . . . . . .
31,732 (57,271) (26,088)
(Increase) decrease in other current assets ...........................
(35,133) (24,312) 134,175
Increase (decrease) in other current liabilities . . . . . . . . . . . . . . . . . . . . . . . . .
73,222 51,838 (105,155)
Other .........................................................
86,060 (11,276) 10,028
Net cash provided by operating activities. . . . . . . . . . . . . . . . . . . . . . . . .
561,028 757,684 407,153
(Continued on following page)
Consolidated Statements of Cash Flows
Sony Corporation and Consolidated Subsidiaries—Years ended March 31