Starbucks 2013 Annual Report Download - page 11
Download and view the complete annual report
Please find page 11 of the 2013 Starbucks annual report below. You can navigate through the pages in the report by either clicking on the pages listed below, or by using the keyword search tool below to find specific information within the annual report.-
 1
1 -
 2
2 -
 3
3 -
 4
4 -
 5
5 -
 6
6 -
 7
7 -
 8
8 -
 9
9 -
 10
10 -
 11
11 -
 12
12 -
 13
13 -
 14
14 -
 15
15 -
 16
16 -
 17
17 -
 18
18 -
 19
19 -
 20
20 -
 21
21 -
 22
22 -
23
-
24
-
25
-
26
-
27
-
28
-
29
-
30
-
31
-
32
-
33
-
34
-
35
-
36
-
37
-
38
-
39
-
40
-
41
-
42
-
43
-
44
-
45
-
46
-
47
-
48
-
49
-
50
-
51
-
52
-
53
-
54
-
55
-
56
-
57
-
58
-
59
-
60
-
61
-
62
-
63
-
64
-
65
-
66
-
67
-
68
-
69
-
70
-
71
-
72
-
73
-
74
-
75
-
76
-
77
-
78
-
79
-
80
-
81
-
82
-
83
-
84
-
85
-
86
-
87
-
88
-
89
-
90
-
91
-
92
-
93
-
94
-
95
-
96
-
97
-
98
-
99
-
100
 |
 |
3
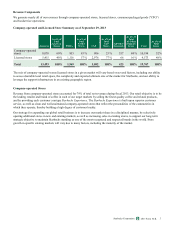
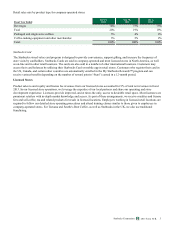
Revenue Components
We generate nearly all of our revenues through company-operated stores, licensed stores, consumer packaged goods ("CPG")
and foodservice operations.
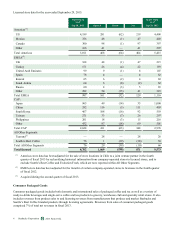
Company-operated and Licensed Store Summary as of September 29, 2013
Americas
As a% of
Total
Americas
Stores EMEA
As a% of
Total
EMEA
Stores CAP
As a% of
Total
CAP
Stores
All Other
Segments
As a% of
Total
All Other
Segments
Stores Total
As a% of
Total
Stores
Company-operated
stores 8,078 60 % 853 43 % 906 23 % 357 84 % 10,194 52 %
Licensed stores 5,415 40 % 1,116 57 % 2,976 77 % 66 16 % 9,573 48 %
Total 13,493 100% 1,969 100% 3,882 100% 423 100% 19,767 100%
The mix of company-operated versus licensed stores in a given market will vary based on several factors, including our ability
to access desirable local retail space, the complexity and expected ultimate size of the market for Starbucks, and our ability to
leverage the support infrastructure in an existing geographic region.
Company-operated Stores
Revenue from company-operated stores accounted for 79% of total net revenues during fiscal 2013. Our retail objective is to be
the leading retailer and brand of coffee in each of our target markets by selling the finest quality coffee and related products,
and by providing each customer a unique Starbucks Experience. The Starbucks Experience is built upon superior customer
service, as well as clean and well-maintained company-operated stores that reflect the personalities of the communities in
which they operate, thereby building a high degree of customer loyalty.
Our strategy for expanding our global retail business is to increase our market share in a disciplined manner, by selectively
opening additional stores in new and existing markets, as well as increasing sales in existing stores, to support our long-term
strategic objective to maintain Starbucks standing as one of the most recognized and respected brands in the world. Store
growth in specific existing markets will vary due to many factors, including the maturity of the market.
2013 10-K
Starbucks Corporation Form