Starbucks 2013 Annual Report Download - page 40
Download and view the complete annual report
Please find page 40 of the 2013 Starbucks annual report below. You can navigate through the pages in the report by either clicking on the pages listed below, or by using the keyword search tool below to find specific information within the annual report.-
 1
1 -
2
-
3
-
4
-
5
-
6
-
7
-
8
-
9
-
10
-
11
-
12
-
13
-
14
-
15
-
16
-
17
-
18
-
19
-
20
-
21
-
22
-
23
-
24
-
25
-
26
-
27
-
28
-
29
-
 30
30 -
 31
31 -
 32
32 -
 33
33 -
 34
34 -
 35
35 -
 36
36 -
 37
37 -
 38
38 -
 39
39 -
 40
40 -
 41
41 -
 42
42 -
 43
43 -
 44
44 -
 45
45 -
 46
46 -
 47
47 -
 48
48 -
 49
49 -
 50
50 -
51
-
52
-
53
-
54
-
55
-
56
-
57
-
58
-
59
-
60
-
61
-
62
-
63
-
64
-
65
-
66
-
67
-
68
-
69
-
70
-
71
-
72
-
73
-
74
-
75
-
76
-
77
-
78
-
79
-
80
-
81
-
82
-
83
-
84
-
85
-
86
-
87
-
88
-
89
-
90
-
91
-
92
-
93
-
94
-
95
-
96
-
97
-
98
-
99
-
100
 |
 |
32
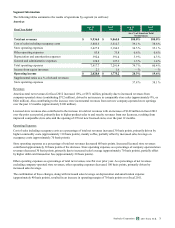
EMEA
Fiscal Year Ended
Sep 30,
2012
Oct 2,
2011
Sep 30,
2012
Oct 2,
2011
As a % of EMEA Total
Net Revenues
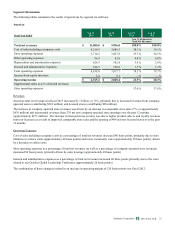
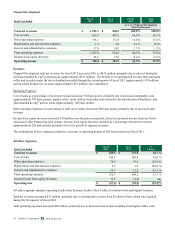
Total net revenues $ 1,141.3 $ 1,046.8 100.0% 100.0%
Cost of sales including occupancy costs 597.3 530.3 52.3 % 50.7 %
Store operating expenses 371.1 327.3 32.5 % 31.3 %
Other operating expenses 33.6 36.5 2.9 % 3.5 %
Depreciation and amortization expenses 57.1 53.4 5.0 % 5.1 %
General and administrative expenses 75.7 66.4 6.6 % 6.3 %
Total operating expenses 1,134.8 1,013.9 99.4 % 96.9 %
Income from equity investees 0.3 6.0 — % 0.6 %
Operating income $ 6.8 $ 38.9 0.6% 3.7%
Supplemental ratios as a % of related revenues:
Store operating expenses 38.3 % 36.1 %
Revenues
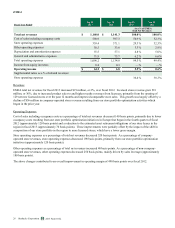
EMEA total net revenues for fiscal 2012 increased 9%, or $95 million, primarily driven by increased revenues from company-
operated stores (contributing $63 million), due to the acquisition of the remaining interest in our previous joint venture
operations in Switzerland and Austria in the fourth quarter of fiscal 2011 (approximately $80 million), partially offset by
unfavorable foreign currency fluctuations (approximately $33 million).
An increase in licensed store revenues of $27 million also contributed to the increase in total net revenues, primarily due to
higher product sales to and royalty revenues from our licensees, resulting from the opening of 101 net new licensed stores over
the past 12 months.
Operating Expenses
Cost of sales including occupancy costs as a percentage of total net revenues increased 160 basis points, primarily driven by
higher costs related to the transition to a consolidated food and dairy distribution model in the UK that began in the first quarter
of fiscal 2012 (approximately 180 basis points). These costs are expected to decline over time as the full benefits of the
transition are realized. Also contributing to the increase were costs related to store portfolio optimization initiatives occurring in
the fourth quarter of fiscal 2012 (approximately 60 basis points), partially offset by increased sales leverage on occupancy
costs.
Store operating expenses as a percentage of total net revenues increased 120 basis points. Store operating expenses as a
percentage of company-operated store revenues increased 220 basis points, primarily driven by asset impairments related to
underperforming stores (approximately 140 basis points). Also contributing to the increase were costs related to store portfolio
optimization initiatives occurring in the fourth quarter of fiscal 2012 (approximately 40 basis points).
Other operating expenses as a percentage of total net revenues decreased 60 basis points. Excluding the impact of company-
operated store revenues, other operating expenses decreased 640 basis points, primarily driven by operational efficiencies.
Income from equity investees declined to $0.3 million in fiscal 2012, due to the acquisition of the remaining interest in our
previous joint venture operations in Switzerland and Austria.
The above changes contributed to a decrease in operating margin of 310 basis points over the prior year.
2013 10-K
Starbucks Corporation Form