Starbucks 2013 Annual Report Download - page 30
Download and view the complete annual report
Please find page 30 of the 2013 Starbucks annual report below. You can navigate through the pages in the report by either clicking on the pages listed below, or by using the keyword search tool below to find specific information within the annual report.-
 1
1 -
2
-
3
-
4
-
5
-
6
-
7
-
8
-
9
-
10
-
11
-
12
-
13
-
14
-
15
-
16
-
17
-
18
-
19
-
 20
20 -
 21
21 -
 22
22 -
 23
23 -
 24
24 -
 25
25 -
 26
26 -
 27
27 -
 28
28 -
 29
29 -
 30
30 -
 31
31 -
 32
32 -
 33
33 -
 34
34 -
 35
35 -
 36
36 -
 37
37 -
 38
38 -
 39
39 -
 40
40 -
41
-
42
-
43
-
44
-
45
-
46
-
47
-
48
-
49
-
50
-
51
-
52
-
53
-
54
-
55
-
56
-
57
-
58
-
59
-
60
-
61
-
62
-
63
-
64
-
65
-
66
-
67
-
68
-
69
-
70
-
71
-
72
-
73
-
74
-
75
-
76
-
77
-
78
-
79
-
80
-
81
-
82
-
83
-
84
-
85
-
86
-
87
-
88
-
89
-
90
-
91
-
92
-
93
-
94
-
95
-
96
-
97
-
98
-
99
-
100
 |
 |

22
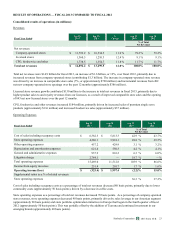
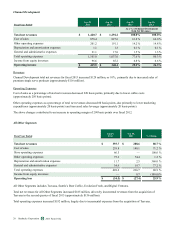
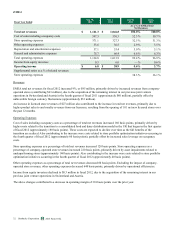
Channel Development segment revenues grew 10% in fiscal 2013, primarily due to increased sales of premium single serve
products. Lower coffee costs was the primary contributor to the 290 basis point increase in operating margin for fiscal 2013. As
we continue to expand customer occasions outside of our retail stores, including growing our presence in the premium single
serve category, we expect this segment will become a more significant contributor to our future growth.
Our consolidated operating results included a litigation charge as a result of the conclusion of our arbitration with Kraft which
resulted in a pretax charge to operating expenses of $2.8 billion. The conclusion of this litigation is described in more detail in
Note 15 to the consolidated financial statements included in Item 8 of Part II of this 10-K. We believe we have adequate
liquidity to fund this expected payment, both in the form of cash on hand and the expected issuance of additional debt in fiscal
2014.
Fiscal 2014 — The View Ahead
For fiscal year 2014, we expect revenue growth driven by mid-single-digit global comparable store sales growth, 1,500 new
store openings, and continued growth in the Channel Development business.
We expect fiscal year 2014 consolidated operating margin improvement, when compared to our fiscal 2013 operating results
excluding the litigation charge associated with the Kraft arbitration, of 150 to 200 basis points and strong EPS growth, driven
primarily by leverage on revenue growth.
The effective tax rate for fiscal 2014 is expected to be approximately 34.5%.
Capital expenditures in fiscal 2014 are expected to be approximately $1.2 billion, primarily for store renovations and new
stores, as well for other investments to support our ongoing growth initiatives.
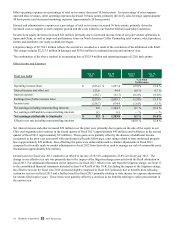
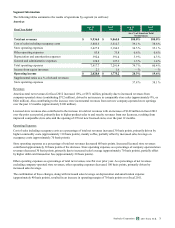
Operating Segment Overview
Starbucks has four reportable operating segments: 1) Americas, inclusive of the US, Canada, and Latin America markets; 2)
Europe, Middle East, and Africa, ("EMEA"); 3) China / Asia Pacific (“CAP”) and 4) Channel Development. All Other
Segments includes Teavana, Seattle's Best Coffee and Evolution Fresh, as well as our Digital Ventures business.
The Americas, EMEA and CAP segments include company-operated stores and licensed stores. Licensed stores generally have
a higher operating margin than company-operated stores. Under the licensed model, Starbucks receives a reduced share of the
total store revenues, but this is more than offset by the reduction in its share of costs as these are primarily incurred by the
licensee. The EMEA and CAP segments have a higher relative share of licensed stores versus company-operated stores
compared to the Americas segment; however, the Americas segment has been operating significantly longer than the other
segments and has developed deeper awareness of, and attachment to, the Starbucks brand and stores among its customer base.
As a result, the more mature Americas segment has significantly more stores and higher total revenues than the other two
segments. Average sales per store are also higher in the Americas due to various factors including length of time in market.
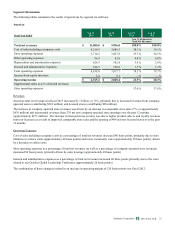
In certain international markets occupancy costs and store operating expenses can be higher than in the US market due to
higher rents for prime store locations or costs of compliance with country-specific regulatory requirements. Because many of
our international operations are in an early phase of development, operating expenses as a percentage of related revenues are
often higher compared to the US market. International markets in the early stages of development require a more extensive
support organization, relative to the current levels of revenue and operating income, than the US market.
We continue to add new stores in both existing, more-mature markets such as the US, and in newer, higher growth markets
such as China. Our disciplined approach to expanding our global store base also includes optimizing the mix of company-
operated and licensed stores in each market.
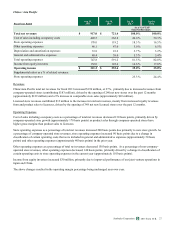
Our Channel Development segment includes whole bean and ground coffees, premium Tazo® teas, Starbucks- and Tazo-
branded single serve products, a variety of ready-to-drink beverages, such as Starbucks Refreshers™ beverages, and other
branded products sold worldwide through channels such as grocery stores, warehouse clubs, specialty retailers, convenience
stores, and US foodservice accounts. Ready-to-drink beverages are primarily manufactured and distributed through The North
American Coffee Partnership, a joint venture with the Pepsi-Cola Company. The proportionate share of the results of the joint
venture is included, on a net basis, in income from equity investees on the consolidated statements of earnings.
Acquisitions
See Note 2 to the consolidated financial statements included in Item 8 of Part II of this 10-K for information regarding
acquisitions.
2013 10-K
Starbucks Corporation Form