Starbucks 2013 Annual Report Download - page 42
Download and view the complete annual report
Please find page 42 of the 2013 Starbucks annual report below. You can navigate through the pages in the report by either clicking on the pages listed below, or by using the keyword search tool below to find specific information within the annual report.-
 1
1 -
2
-
3
-
4
-
5
-
6
-
7
-
8
-
9
-
10
-
11
-
12
-
13
-
14
-
15
-
16
-
17
-
18
-
19
-
20
-
21
-
22
-
23
-
24
-
25
-
26
-
27
-
28
-
29
-
30
-
31
-
 32
32 -
 33
33 -
 34
34 -
 35
35 -
 36
36 -
 37
37 -
 38
38 -
 39
39 -
 40
40 -
 41
41 -
 42
42 -
 43
43 -
 44
44 -
 45
45 -
 46
46 -
 47
47 -
 48
48 -
 49
49 -
 50
50 -
 51
51 -
 52
52 -
53
-
54
-
55
-
56
-
57
-
58
-
59
-
60
-
61
-
62
-
63
-
64
-
65
-
66
-
67
-
68
-
69
-
70
-
71
-
72
-
73
-
74
-
75
-
76
-
77
-
78
-
79
-
80
-
81
-
82
-
83
-
84
-
85
-
86
-
87
-
88
-
89
-
90
-
91
-
92
-
93
-
94
-
95
-
96
-
97
-
98
-
99
-
100
 |
 |
34
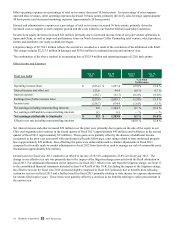
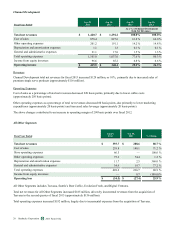
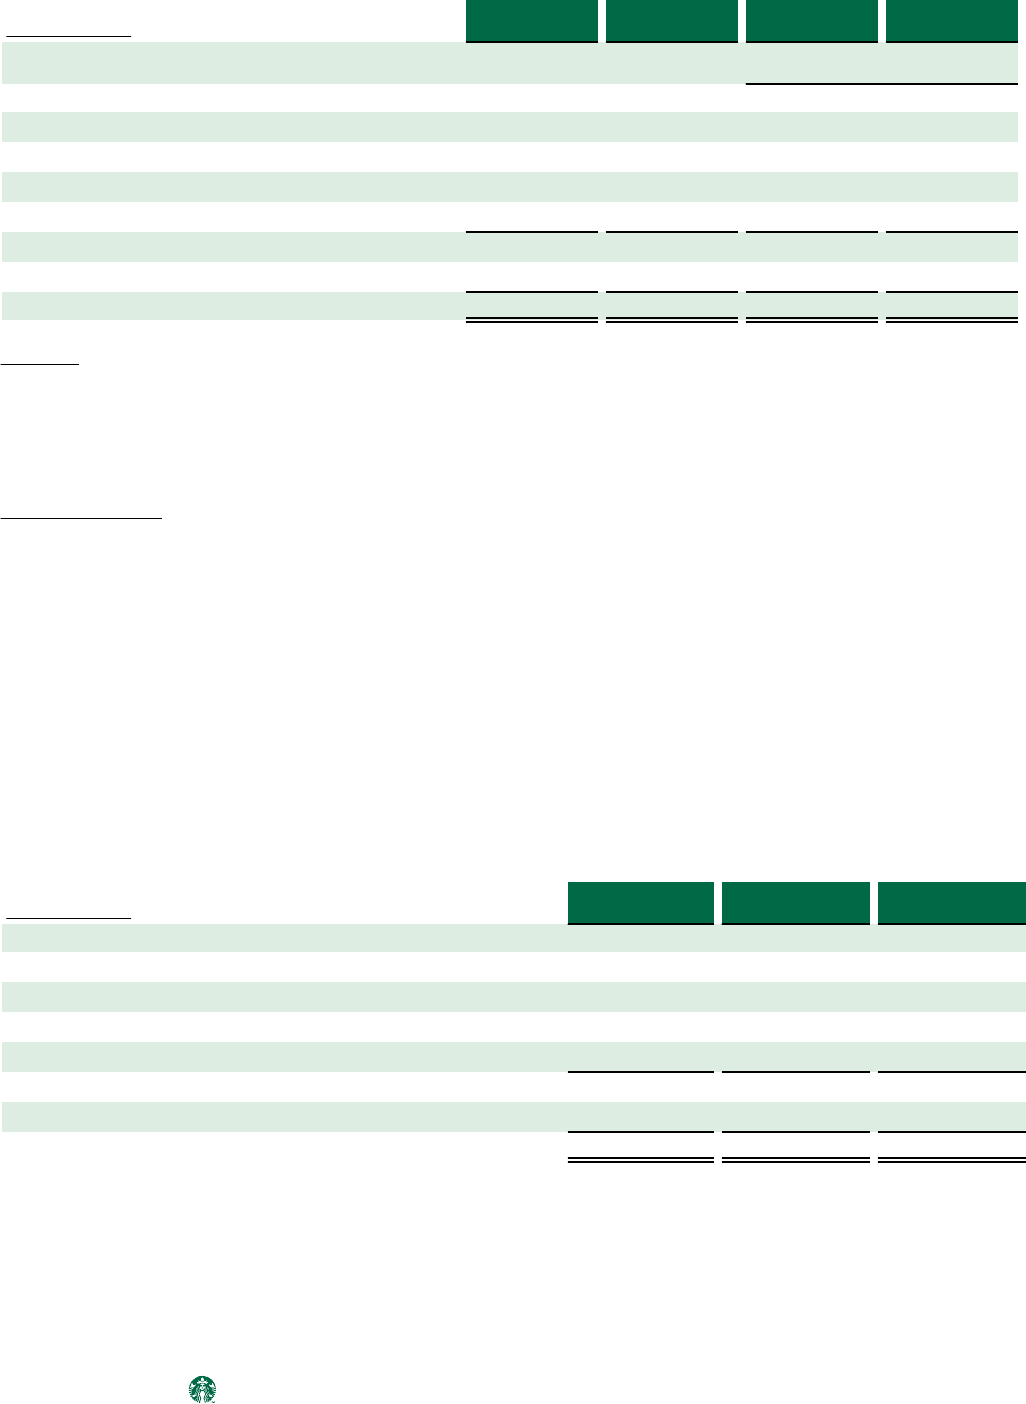
Channel Development
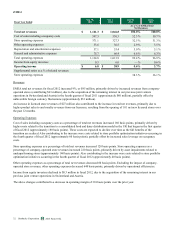
Fiscal Year Ended
Sep 30,
2012
Oct 2,
2011
Sep 30,
2012
Oct 2,
2011
As a % of Channel Development
Total Net Revenues
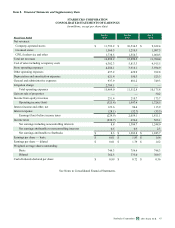
Total net revenues $ 1,292.2 $ 860.5 100.0% 100.0%
Cost of sales 827.6 487.5 64.0 % 56.7 %
Other operating expenses 191.1 151.8 14.8 % 17.6 %
Depreciation and amortization expenses 1.3 2.4 0.1 % 0.3 %
General and administrative expenses 17.0 10.9 1.3 % 1.3 %
Total operating expenses 1,037.0 652.6 80.3 % 75.8 %
Income from equity investees 85.2 75.6 6.6 % 8.8 %
Operating income $ 340.4 $ 283.5 26.3% 32.9%
Revenues
Channel Development total net revenues for fiscal 2012 increased 50%, or $432 million, primarily due to sales of Starbucks-
and Tazo-branded K-Cup® portion packs (approximately $232 million). The benefit of recognizing full revenue from packaged
coffee and tea sales under the direct distribution model through the second quarter of fiscal 2012 (approximately $70 million)
and increased foodservice revenues (approximately $33 million) also contributed.
Operating Expenses
Cost of sales as a percentage of total net revenues increased 730 basis points, primarily due to increased commodity costs
(approximately 570 basis points), mainly coffee, and a shift in our product mix driven by the introduction of Starbucks- and
Tazo-branded K-Cup® portion packs (approximately 140 basis points).
Other operating expenses as a percentage of total net revenues decreased 280 basis points, primarily due to increased sales
leverage.
Income from equity investees increased $10 million over the prior year period, driven by increased income from our North
American Coffee Partnership joint venture. Income from equity investees declined as a percentage of total net revenues
(approximately 220 basis points) primarily due to the growth in segment revenues.
The combination of these changes resulted in a decrease in operating margin of 660 basis points over fiscal 2011.
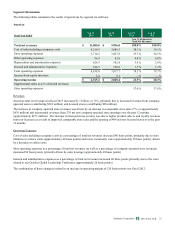
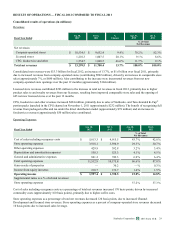
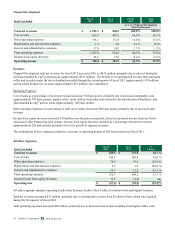
All Other Segments
Fiscal Year Ended
Sep 30,
2012
Oct 2,
2011
%
Change
Total net revenues $ 208.6 $ 175.8 18.7 %
Cost of sales 140.1 103.0 36.0 %
Other operating expenses 74.4 93.0 (20.0 )%
Depreciation and amortization expenses 2.5 1.0 150.0 %
General and administrative expenses 19.7 12.2 61.5 %
Total operating expenses 236.7 209.2 13.1 %
Income/(Loss) from equity investees 0.7 (2.4) nm
Operating loss $ (27.4) $ (35.8)(23.5)%
All other segments includes operating results from Teavana, Seattle’s Best Coffee, Evolution Fresh and Digital Ventures.
Total net revenues increased $33 million, primarily due to incremental revenues from Evolution Fresh, which was acquired
during the first quarter of fiscal 2012.
Total operating expenses increased $28 million, primarily due to increased cost of sales resulting from higher coffee costs.
2013 10-K
Starbucks Corporation Form