Starbucks 2013 Annual Report Download - page 38
Download and view the complete annual report
Please find page 38 of the 2013 Starbucks annual report below. You can navigate through the pages in the report by either clicking on the pages listed below, or by using the keyword search tool below to find specific information within the annual report.-
 1
1 -
2
-
3
-
4
-
5
-
6
-
7
-
8
-
9
-
10
-
11
-
12
-
13
-
14
-
15
-
16
-
17
-
18
-
19
-
20
-
21
-
22
-
23
-
24
-
25
-
26
-
27
-
 28
28 -
 29
29 -
 30
30 -
 31
31 -
 32
32 -
 33
33 -
 34
34 -
 35
35 -
 36
36 -
 37
37 -
 38
38 -
 39
39 -
 40
40 -
 41
41 -
 42
42 -
 43
43 -
 44
44 -
 45
45 -
 46
46 -
 47
47 -
 48
48 -
49
-
50
-
51
-
52
-
53
-
54
-
55
-
56
-
57
-
58
-
59
-
60
-
61
-
62
-
63
-
64
-
65
-
66
-
67
-
68
-
69
-
70
-
71
-
72
-
73
-
74
-
75
-
76
-
77
-
78
-
79
-
80
-
81
-
82
-
83
-
84
-
85
-
86
-
87
-
88
-
89
-
90
-
91
-
92
-
93
-
94
-
95
-
96
-
97
-
98
-
99
-
100
 |
 |
30
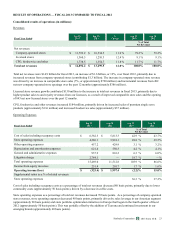
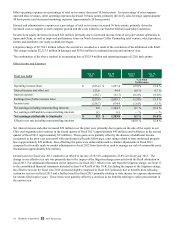
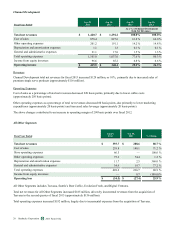
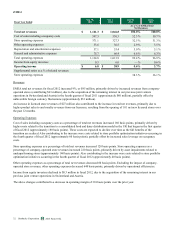
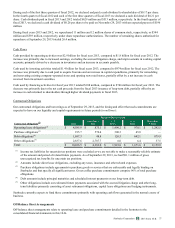
Other operating expenses as a percentage of total net revenues decreased 20 basis points. As a percentage of net revenues
excluding company-operated store revenues, other operating expenses decreased 350 basis points. This decrease was primarily
driven by increased sales leverage (approximately 150 basis points), the absence of charges in fiscal 2012 related to the
Seattle’s Best Coffee® store closures in Borders bookstores (approximately 80 basis points) and a shift in the timing of
marketing spend (approximately 60 basis points).
Income from equity investees increased $37.0 million, primarily due to an increase in income from our North American Coffee
Partnership (approximately $13 million), Japan (approximately $11 million) and Shanghai (approximately $10 million) joint
venture operations.
The combination of these changes, along with increased sales leverage on depreciation and amortization (approximately 40
basis points) and general and administrative expenses (approximately 40 basis points), resulted in an increase in operating
margin of 20 basis points over fiscal 2011.
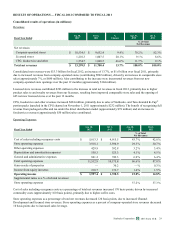
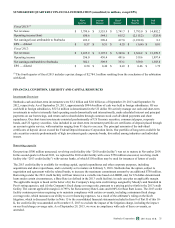
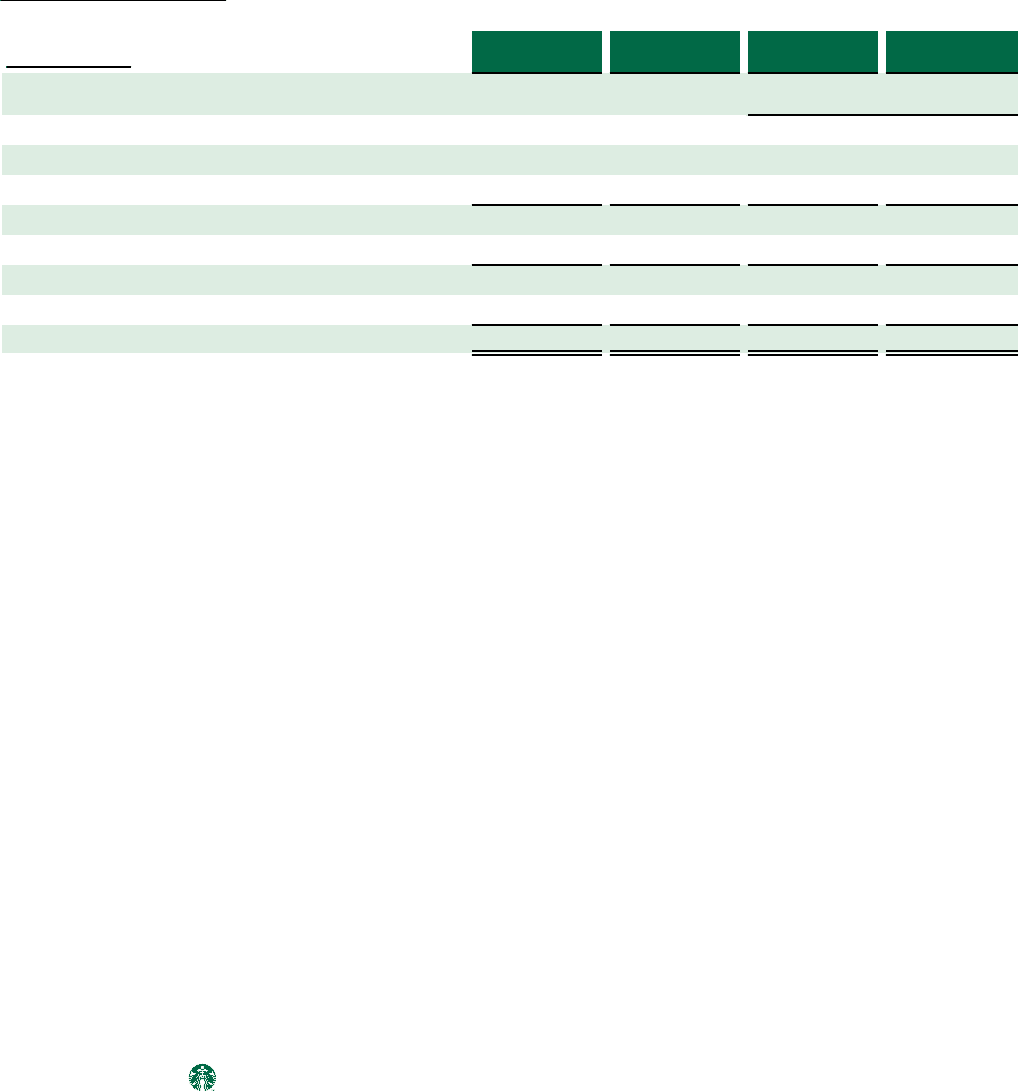
Other Income and Expenses
Fiscal Year Ended
Sep 30,
2012
Oct 2,
2011
Sep 30,
2012
Oct 2,
2011
% of Total
Net Revenues
Operating income $ 1,997.4 $ 1,728.5 15.0 % 14.8 %
Interest income and other, net 94.4 115.9 0.7 % 1.0 %
Interest expense (32.7)(33.3) (0.2)% (0.3)%
Earnings before income taxes 2,059.1 1,811.1 15.5 % 15.5 %
Income taxes 674.4 563.1 5.1 % 4.8 %
Net earnings including noncontrolling interests 1,384.7 1,248.0 10.4 % 10.7 %
Net earnings attributable to noncontrolling interests 0.9 2.3 — % — %
Net earnings attributable to Starbucks $ 1,383.8 $ 1,245.7 10.4 % 10.6 %
Effective tax rate including noncontrolling interests 32.8 % 31.1 %
Net interest income and other decreased $21 million over the prior year, primarily due to the absence of the gain recognized in
the fourth quarter of fiscal 2011 resulting from the acquisition of the remaining interest in our previous joint venture operations
in Switzerland and Austria (approximately $55 million), partially offset by the recognition of additional income associated with
unredeemed gifts cards in the second quarter of fiscal 2012 (approximately $29 million), following a court ruling related to
state unclaimed property laws.
Income taxes for the fiscal year ended 2012 resulted in an effective tax rate of 32.8% compared to 31.1% for fiscal year 2011.
The rate increased in fiscal year 2012 primarily due to tax benefits recognized in fiscal 2011 from the Switzerland and Austria
transaction and the release of foreign valuation allowances.
2013 10-K
Starbucks Corporation Form