Starbucks 2013 Annual Report Download - page 82
Download and view the complete annual report
Please find page 82 of the 2013 Starbucks annual report below. You can navigate through the pages in the report by either clicking on the pages listed below, or by using the keyword search tool below to find specific information within the annual report.-
 1
1 -
2
-
3
-
4
-
5
-
6
-
7
-
8
-
9
-
10
-
11
-
12
-
13
-
14
-
15
-
16
-
17
-
18
-
19
-
20
-
21
-
22
-
23
-
24
-
25
-
26
-
27
-
28
-
29
-
30
-
31
-
32
-
33
-
34
-
35
-
36
-
37
-
38
-
39
-
40
-
41
-
42
-
43
-
44
-
45
-
46
-
47
-
48
-
49
-
50
-
51
-
52
-
53
-
54
-
55
-
56
-
57
-
58
-
59
-
60
-
61
-
62
-
63
-
64
-
65
-
66
-
67
-
68
-
69
-
70
-
71
-
 72
72 -
 73
73 -
 74
74 -
 75
75 -
 76
76 -
 77
77 -
 78
78 -
 79
79 -
 80
80 -
 81
81 -
 82
82 -
 83
83 -
 84
84 -
 85
85 -
 86
86 -
 87
87 -
 88
88 -
 89
89 -
 90
90 -
 91
91 -
 92
92 -
93
-
94
-
95
-
96
-
97
-
98
-
99
-
100
 |
 |
74
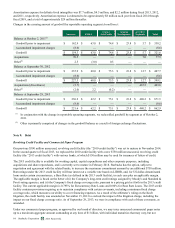
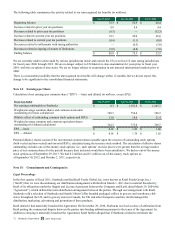
reporting changes. Historical financial information presented herein reflects these changes. There was no impact on
consolidated net revenues, total operating expenses, operating income, or net earnings as a result of these changes.
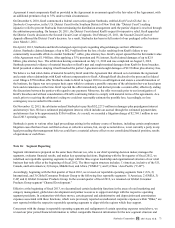
Beginning in the second quarter of fiscal 2013, we removed unallocated corporate expenses from Other. Other is now referred
to as All Other Segments and includes Teavana, Seattle's Best Coffee and Evolution Fresh, as well as our Digital Ventures
business. Unallocated corporate operating expenses, which pertain primarily to corporate administrative functions that support
the operating segments but are not specifically attributable to or managed by any segment, are presented as a reconciling item
between total segment operating results and consolidated financial results. While our consolidated results are not impacted, our
historical segment financial information has been revised to be consistent with the current presentation.
Americas
Americas operations sell coffee and other beverages, complementary food, packaged coffees, single serve coffee products and a
focused selection of merchandise through company-operated stores and licensed stores. The Americas segment is our most
mature business and has achieved significant scale.
Europe, Middle East, and Africa
EMEA operations sell coffee and other beverages, complementary food, packaged coffees, single serve coffee products and a
focused selection of merchandise through company-operated stores and licensed stores. Certain markets within EMEA
operations are in the early stages of development and require a more extensive support organization, relative to the current
levels of revenue and operating income, than Americas.
China / Asia Pacific
China /Asia Pacific operations sell coffee and other beverages, complementary food, packaged coffees, single serve coffee
products and a focused selection of merchandise through company-operated stores and licensed stores. Certain markets within
China / Asia Pacific operations are in the early stages of development and require a more extensive support organization,
relative to the current levels of revenue and operating income, than Americas.
Channel Development
Channel Development operations sell a selection of packaged coffees as well as a selection of premium Tazo® teas globally.
Channel Development operations also produce and sell a variety of ready-to-drink beverages, Starbucks- and Tazo-branded
single serve products, and Starbucks Refreshers™ beverages. The US foodservice business, which is included in the Channel
Development segment, sells coffee and other related products to institutional foodservice companies.
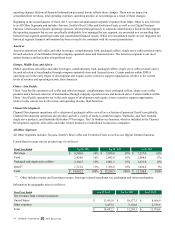
All Other Segments
All Other Segments includes Teavana, Seattle's Best Coffee and Evolution Fresh, as well as our Digital Ventures business.
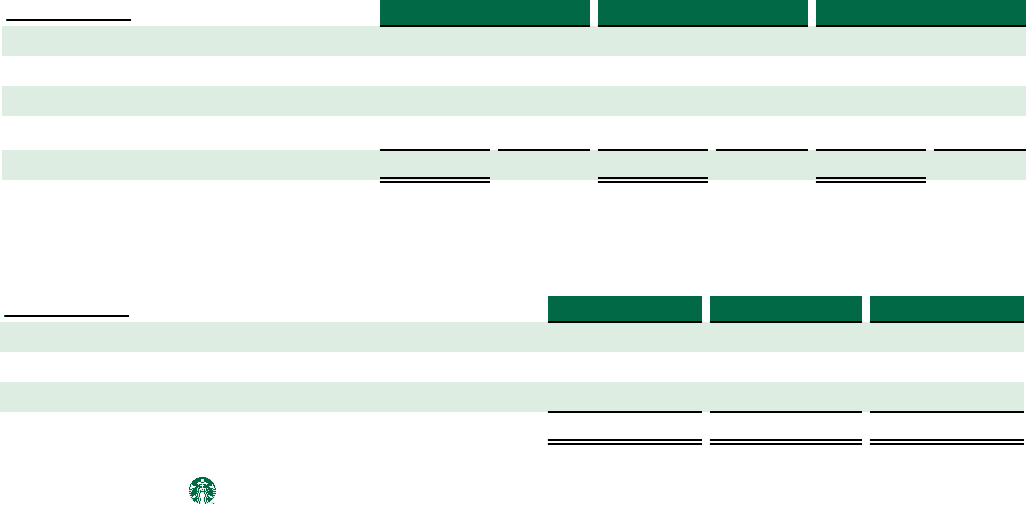
Consolidated revenue mix by product type (in millions):
Fiscal Year Ended Sep 29, 2013 Sep 30, 2012 Oct 2, 2011
Beverage $ 8,588.9 58% $ 7,838.8 59% $ 7,217.0 62%
Food 2,424.6 16% 2,092.8 16% 2,008.0 17%
Packaged and single serve coffees 2,166.5 15% 2,001.1 15% 1,451.0 12%
Other(1) 1,712.2 11% 1,366.8 10% 1,024.4 9%
Total $ 14,892.2 100% $ 13,299.5 100% $ 11,700.4 100%
(1) Other includes royalty and licensing revenues, beverage-related ingredients, tea, packaging and other merchandise.
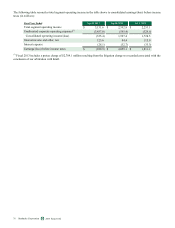
Information by geographic area (in millions):
Fiscal Year Ended Sep 29, 2013 Sep 30, 2012 Oct 2, 2011
Net revenues from external customers:
United States $ 11,415.0 $ 10,177.5 $ 8,966.9
Other countries 3,477.2 3,122.0 2,733.5
Total $ 14,892.2 $ 13,299.5 $ 11,700.4
2013 10-K
Starbucks Corporation Form