Starbucks 2013 Annual Report Download - page 74
Download and view the complete annual report
Please find page 74 of the 2013 Starbucks annual report below. You can navigate through the pages in the report by either clicking on the pages listed below, or by using the keyword search tool below to find specific information within the annual report.-
 1
1 -
2
-
3
-
4
-
5
-
6
-
7
-
8
-
9
-
10
-
11
-
12
-
13
-
14
-
15
-
16
-
17
-
18
-
19
-
20
-
21
-
22
-
23
-
24
-
25
-
26
-
27
-
28
-
29
-
30
-
31
-
32
-
33
-
34
-
35
-
36
-
37
-
38
-
39
-
40
-
41
-
42
-
43
-
44
-
45
-
46
-
47
-
48
-
49
-
50
-
51
-
52
-
53
-
54
-
55
-
56
-
57
-
58
-
59
-
60
-
61
-
62
-
63
-
 64
64 -
 65
65 -
 66
66 -
 67
67 -
 68
68 -
 69
69 -
 70
70 -
 71
71 -
 72
72 -
 73
73 -
 74
74 -
 75
75 -
 76
76 -
 77
77 -
 78
78 -
 79
79 -
 80
80 -
 81
81 -
 82
82 -
 83
83 -
 84
84 -
85
-
86
-
87
-
88
-
89
-
90
-
91
-
92
-
93
-
94
-
95
-
96
-
97
-
98
-
99
-
100
 |
 |
66
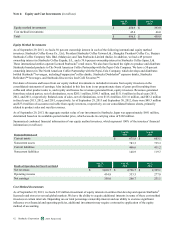
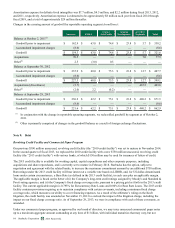
Note 11: Shareholders’ Equity
In addition to 1.2 billion shares of authorized common stock with $0.001 par value per share, we have authorized 7.5 million
shares of preferred stock, none of which was outstanding at September 29, 2013.
Included in additional paid-in capital in our consolidated statements of equity as of September 29, 2013 and September 30,
2012 is $39.4 million related to the increase in value of our share of the net assets of Starbucks Japan at the time of its initial
public stock offering in fiscal 2002.
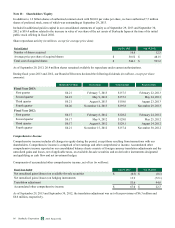
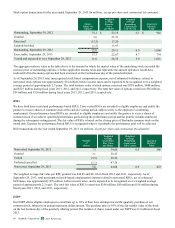
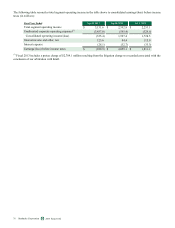
Share repurchase activity (in millions, except for average price data):
Period Ended Sep 29, 2013 Sep 30, 2012
Number of shares acquired 10.8 12.3
Average price per share of acquired shares $ 50.52 $ 48.15
Total cost of acquired shares $ 544.1 $ 593.2
As of September 29, 2013, 26.4 million shares remained available for repurchase under current authorizations.
During fiscal years 2013 and 2012, our Board of Directors declared the following dividends (in millions, except per share
amounts):
Dividend Per Share Record date Total Amount Payment Date
Fiscal Year 2013:
First quarter $0.21 February 7, 2013 $157.5 February 22, 2013
Second quarter $0.21 May 9, 2013 $157.3 May 24, 2013
Third quarter $0.21 August 8, 2013 $158.0 August 23, 2013
Fourth quarter $0.26 November 14, 2013 $195.8 November 29, 2013
Fiscal Year 2012:
First quarter $0.17 February 8, 2012 $128.2 February 24, 2012
Second quarter $0.17 May 9, 2012 $129.0 May 25, 2012
Third quarter $0.17 August 8, 2012 $129.1 August 24, 2012
Fourth quarter $0.21 November 15, 2012 $157.4 November 30, 2012
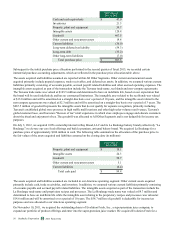
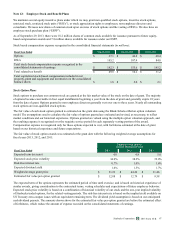
Comprehensive Income
Comprehensive income includes all changes in equity during the period, except those resulting from transactions with our
shareholders. Comprehensive income is comprised of net earnings and other comprehensive income. Accumulated other
comprehensive income reported on our consolidated balance sheets consists of foreign currency translation adjustments and the
unrealized gains and losses, net of applicable taxes, on available-for-sale securities and on derivative instruments designated
and qualifying as cash flow and net investment hedges.
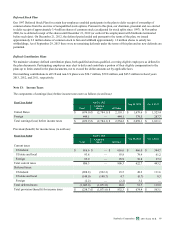
Components of accumulated other comprehensive income, net of tax (in millions):
Fiscal Year Ended Sep 29, 2013 Sep 30, 2012
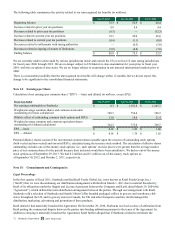
Net unrealized gains/(losses) on available-for-sale securities $(0.5) $ (0.1)
Net unrealized gains/(losses) on hedging instruments 13.9 (72.1)
Translation adjustment 53.6 94.9
Accumulated other comprehensive income $ 67.0 $ 22.7
As of September 29, 2013 and September 30, 2012, the translation adjustment was net of tax provisions of $6.3 million and
$6.6 million, respectively.
2013 10-K
Starbucks Corporation Form