Starbucks 2013 Annual Report Download - page 76
Download and view the complete annual report
Please find page 76 of the 2013 Starbucks annual report below. You can navigate through the pages in the report by either clicking on the pages listed below, or by using the keyword search tool below to find specific information within the annual report.-
 1
1 -
2
-
3
-
4
-
5
-
6
-
7
-
8
-
9
-
10
-
11
-
12
-
13
-
14
-
15
-
16
-
17
-
18
-
19
-
20
-
21
-
22
-
23
-
24
-
25
-
26
-
27
-
28
-
29
-
30
-
31
-
32
-
33
-
34
-
35
-
36
-
37
-
38
-
39
-
40
-
41
-
42
-
43
-
44
-
45
-
46
-
47
-
48
-
49
-
50
-
51
-
52
-
53
-
54
-
55
-
56
-
57
-
58
-
59
-
60
-
61
-
62
-
63
-
64
-
65
-
 66
66 -
 67
67 -
 68
68 -
 69
69 -
 70
70 -
 71
71 -
 72
72 -
 73
73 -
 74
74 -
 75
75 -
 76
76 -
 77
77 -
 78
78 -
 79
79 -
 80
80 -
 81
81 -
 82
82 -
 83
83 -
 84
84 -
 85
85 -
 86
86 -
87
-
88
-
89
-
90
-
91
-
92
-
93
-
94
-
95
-
96
-
97
-
98
-
99
-
100
 |
 |
68
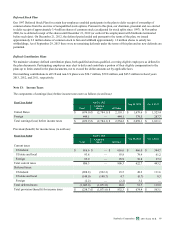
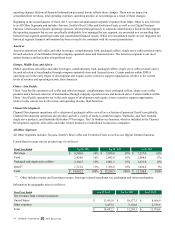
Stock option transactions for the year ended September 29, 2013 (in millions, except per share and contractual life amounts):
Shares
Subject to
Options
Weighted
Average
Exercise
Price
per Share
Weighted
Average
Remaining
Contractual
Life (Years)
Aggregate
Intrinsic
Value
Outstanding, September 30, 2012 33.1 $ 22.19 6.1 $ 945
Granted 3.6 51.23
Exercised (13.2) 17.20
Expired/forfeited (1.5) 33.97
Outstanding, September 29, 2013 22.0 29.11 6.0 1,060
Exercisable, September 29, 2013 13.3 22.07 4.7 734
Vested and expected to vest, September 29, 2013 21.0 28.36 5.9 1,031
The aggregate intrinsic value in the table above is the amount by which the market value of the underlying stock exceeded the
exercise price of outstanding options, is before applicable income taxes and represents the amount optionees would have
realized if all in-the-money options had been exercised on the last business day of the period indicated.
As of September 29, 2013, total unrecognized stock-based compensation expense, net of estimated forfeitures, related to
nonvested stock options was approximately $32 million, before income taxes, and is expected to be recognized over a weighted
average period of approximately 2.7 years. The total intrinsic value of stock options exercised was $539 million, $440 million,
and $323 million during fiscal years 2013, 2012, and 2011, respectively. The total fair value of options vested was $56 million,
$59 million, and $126 million during fiscal years 2013, 2012, and 2011, respectively.
RSUs
We have both time-vested and performance-based RSUs. Time-vested RSUs are awarded to eligible employees and entitle the
grantee to receive shares of common stock at the end of a vesting period, subject solely to the employee’s continuing
employment. Our performance-based RSUs are awarded to eligible employees and entitle the grantee to receive shares of
common stock if we achieve specified performance goals during the performance period and the grantee remains employed
during the subsequent vesting period. The fair value of RSUs is based on the closing price of Starbucks common stock on the
award date. Expense for performance-based RSUs is recognized when it is probable the performance goal will be achieved.
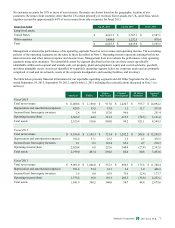
RSU transactions for the year ended September 29, 2013 (in millions, except per share and contractual life amounts):
Number
of
Shares
Weighted
Average
Grant Date
Fair Value
per Share
Weighted
Average
Remaining
Contractual
Life (Years)
Aggregate
Intrinsic
Value
Nonvested, September 30, 2012 7.3 34.68 0.9 366
Granted 3.1 50.23
Vested (3.5) 30.22
Forfeited/cancelled (1.1) 43.26
Nonvested, September 29, 2013 5.8 44.08 0.9 452
The weighted average fair value per RSU granted was $44.05 and $31.06 in fiscal 2012 and 2011, respectively. As of
September 29, 2013, total unrecognized stock-based compensation expense related to nonvested RSUs, net of estimated
forfeitures, was approximately $78 million, before income taxes, and is expected to be recognized over a weighted average
period of approximately 2.2 years. The total fair value of RSUs vested was $104 million, $80 million and $16 million during
fiscal years 2013, 2012, and 2011, respectively.
ESPP
Our ESPP allows eligible employees to contribute up to 10% of their base earnings toward the quarterly purchase of our
common stock, subject to an annual maximum dollar amount. The purchase price is 95% of the fair market value of the stock
on the last business day of the quarterly offering period. The number of shares issued under our ESPP was 0.3 million in fiscal
2013.
2013 10-K
Starbucks Corporation Form