Starbucks 2013 Annual Report Download - page 41
Download and view the complete annual report
Please find page 41 of the 2013 Starbucks annual report below. You can navigate through the pages in the report by either clicking on the pages listed below, or by using the keyword search tool below to find specific information within the annual report.-
 1
1 -
2
-
3
-
4
-
5
-
6
-
7
-
8
-
9
-
10
-
11
-
12
-
13
-
14
-
15
-
16
-
17
-
18
-
19
-
20
-
21
-
22
-
23
-
24
-
25
-
26
-
27
-
28
-
29
-
30
-
 31
31 -
 32
32 -
 33
33 -
 34
34 -
 35
35 -
 36
36 -
 37
37 -
 38
38 -
 39
39 -
 40
40 -
 41
41 -
 42
42 -
 43
43 -
 44
44 -
 45
45 -
 46
46 -
 47
47 -
 48
48 -
 49
49 -
 50
50 -
 51
51 -
52
-
53
-
54
-
55
-
56
-
57
-
58
-
59
-
60
-
61
-
62
-
63
-
64
-
65
-
66
-
67
-
68
-
69
-
70
-
71
-
72
-
73
-
74
-
75
-
76
-
77
-
78
-
79
-
80
-
81
-
82
-
83
-
84
-
85
-
86
-
87
-
88
-
89
-
90
-
91
-
92
-
93
-
94
-
95
-
96
-
97
-
98
-
99
-
100
 |
 |

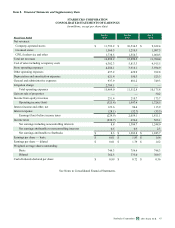
33
China / Asia Pacific
Fiscal Year Ended
Sep 30,
2012
Oct 2,
2011
Sep 30,
2012
Oct 2,
2011
As a % of CAP Total
Net Revenues
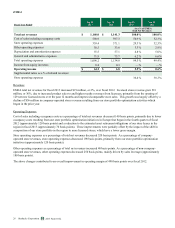
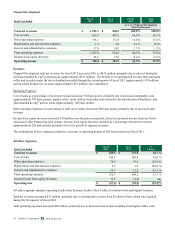
Total net revenues $ 721.4 $ 552.3 100.0% 100.0%
Cost of sales including occupancy costs 362.8 282.0 50.3 % 51.1 %
Store operating expenses 119.2 83.4 16.5 % 15.1 %
Other operating expenses 47.0 35.7 6.5 % 6.5 %
Depreciation and amortization expenses 23.2 18.1 3.2 % 3.3 %
General and administrative expenses 39.0 34.7 5.4 % 6.3 %
Total operating expenses 591.2 453.9 82.0 % 82.2 %
Income from equity investees 122.4 92.9 17.0 % 16.8 %
Operating income $ 252.6 $ 191.3 35.0% 34.6%
Supplemental ratios as a % of related revenues:
Store operating expenses 24.4 % 23.1 %
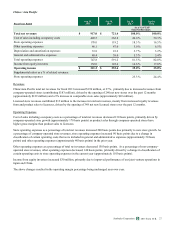
Revenues
China / Asia Pacific total net revenues for fiscal 2012 increased 31%, or $169 million, primarily driven by increased revenues
from company-operated stores (contributing $128 million). The increase in company-operated store revenues was primarily due
to the opening of 154 net new stores over the past 12 months (approximately $71 million) and an increase in comparable store
sales (approximately 15%, or $53 million).
Also contributing to the increase in revenues was an increase in licensed store revenues of $41 million, due to increased royalty
revenues from and product sales to licensees, primarily driven by 294 net new licensed store openings over the past 12 months.
Operating Expenses
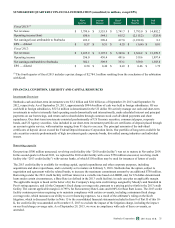
Cost of sales including occupancy costs as a percentage of total net revenues decreased 80 basis points primarily driven by the
accelerated growth of company-operated stores, which contribute a higher gross margin, in China (approximately 140 basis
points), partially offset by increased commodity costs (approximately 120 basis points), mainly higher coffee costs.
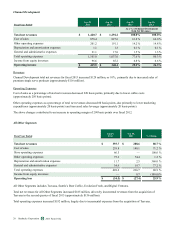
Store operating expenses as a percentage of total net revenues increased 140 basis points. Store operating expenses as a
percentage of company-operated store revenues increased 130 basis points, primarily driven by increased costs associated with
the expansion efforts of company-operated stores in mainland China.
Income from equity investees increased $30 million, primarily driven by an increase in income from our Japan (approximately
$11 million) and Shanghai (approximately $10 million) joint venture operations.
The combination of these changes, along with increased sales leverage on depreciation and amortization (approximately 10
basis points) and general and administrative expenses (approximately 90 basis points), resulted in an increase in operating
margin of 40 basis points over fiscal 2011.
2013 10-K
Starbucks Corporation Form