Starbucks 2013 Annual Report Download - page 6
Download and view the complete annual report
Please find page 6 of the 2013 Starbucks annual report below. You can navigate through the pages in the report by either clicking on the pages listed below, or by using the keyword search tool below to find specific information within the annual report.-
 1
1 -
 2
2 -
 3
3 -
 4
4 -
 5
5 -
 6
6 -
 7
7 -
 8
8 -
 9
9 -
 10
10 -
 11
11 -
 12
12 -
 13
13 -
 14
14 -
 15
15 -
 16
16 -
 17
17 -
18
-
19
-
20
-
21
-
22
-
23
-
24
-
25
-
26
-
27
-
28
-
29
-
30
-
31
-
32
-
33
-
34
-
35
-
36
-
37
-
38
-
39
-
40
-
41
-
42
-
43
-
44
-
45
-
46
-
47
-
48
-
49
-
50
-
51
-
52
-
53
-
54
-
55
-
56
-
57
-
58
-
59
-
60
-
61
-
62
-
63
-
64
-
65
-
66
-
67
-
68
-
69
-
70
-
71
-
72
-
73
-
74
-
75
-
76
-
77
-
78
-
79
-
80
-
81
-
82
-
83
-
84
-
85
-
86
-
87
-
88
-
89
-
90
-
91
-
92
-
93
-
94
-
95
-
96
-
97
-
98
-
99
-
100
 |
 |
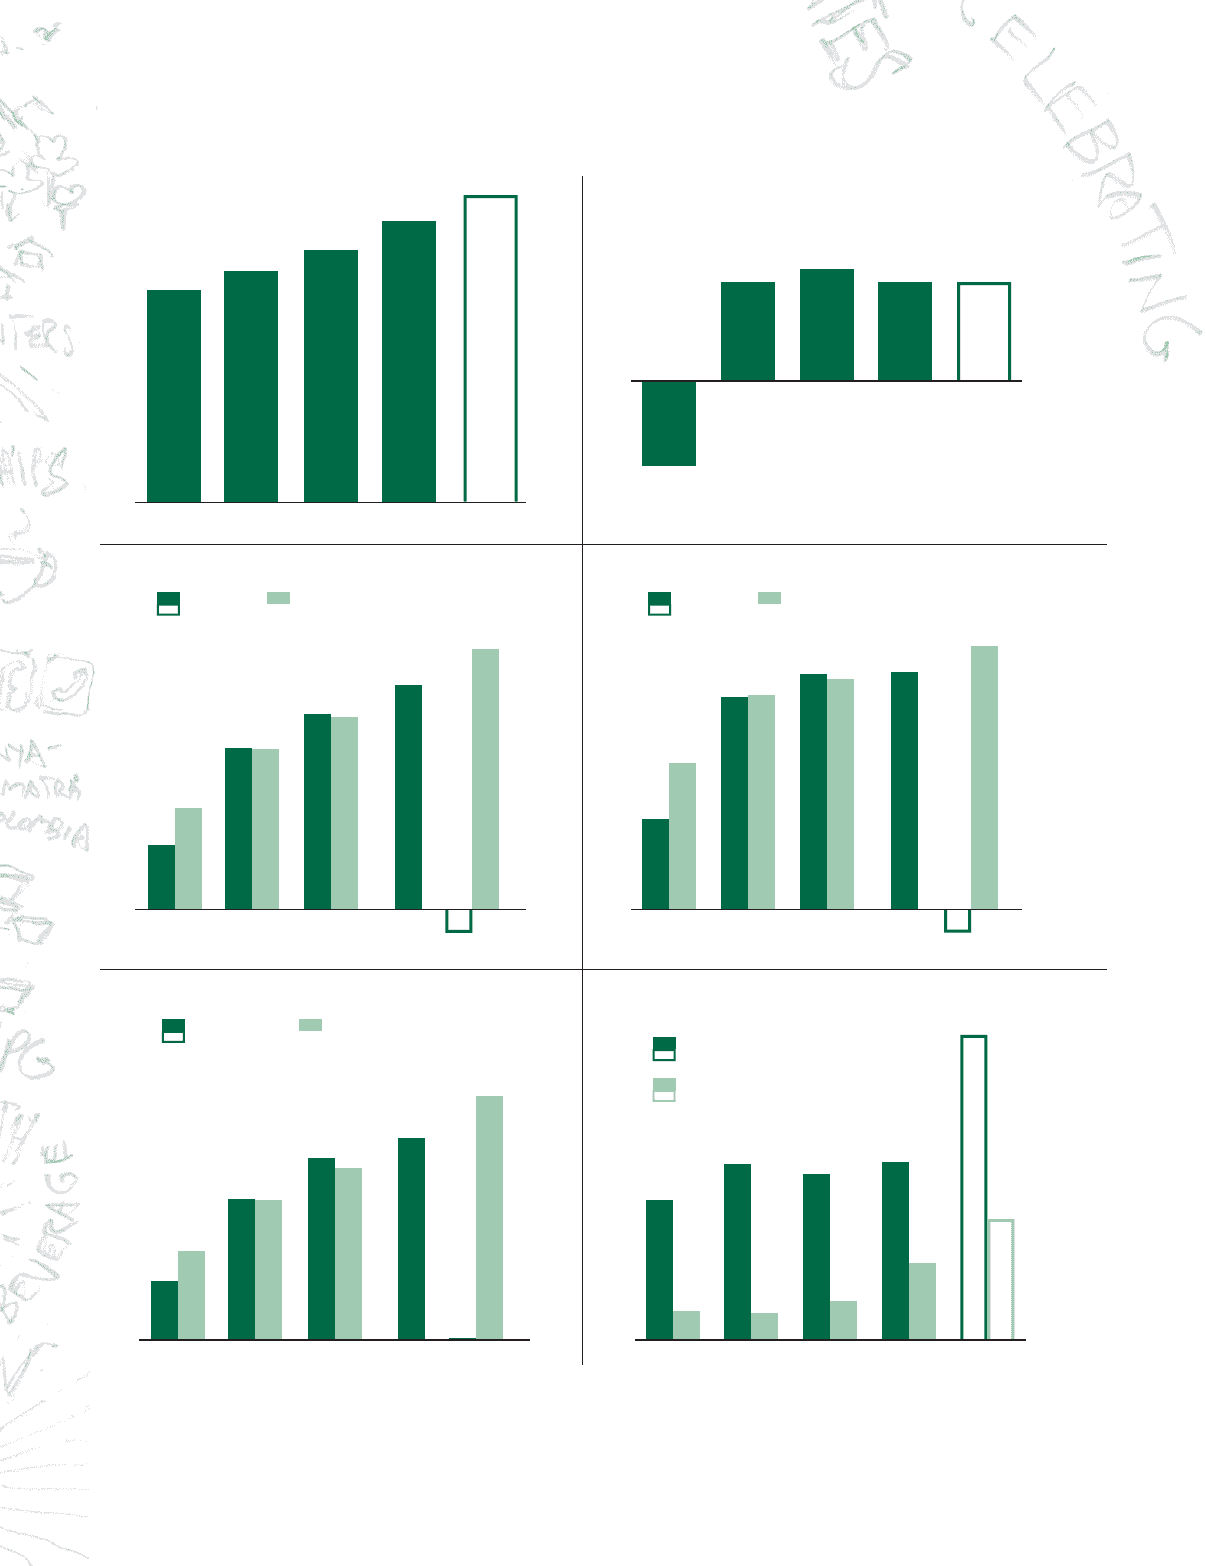
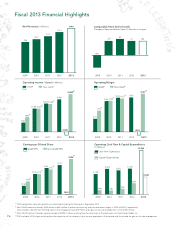
Operating Cash Flow & Capital Expenditures
(in Millions) $2,908
$1,151
7%
$1,612
$532
$1,705
$441
$1,389
$446
Operating Margin
Earnings per Diluted Share
Net Revenues (in Billions) Comparable Store Sales Growth
(Company-Operated Stores Open 13 Months or Longer)
8%
$9.8
(6%)
$10.7
$11.7
7%(A)
$1,728
$1.62
14.8%
$1,419
$1.24
13.3%
$562
$0.52
5.7%
$1,698(B)
$1.52(D)
14.5%(B)
$1,414(B)
$1.23(B)
13.5%(B)
$894(B)
$0.80(B)
9.2%(B)
GAAP
Cash from Operations
Non-GAAP
Capital Expenditures
GAAP Non-GAAP
GAAP EPS Non-GAAP EPS
$13.3
$14.9
$2,459(C)
($325)
16.5%(C)
(2.2%)
$2.26(C)
2009 2010 2011 2012 2013
2009 2010 2011 2012 2013
2009 2010 2011 2012 2013 2009 2010 2011 2012 2013
2009 2010 2011 2012 2013
2009 2010 2011 2012 2013
Operating Income / (Loss) (in Millions)
(A) 2010 comparable store sales growth was calculated excluding the 53rd week in September 2010.
(B) Non-GAAP measure. Excludes $332 million and $53 million in pretax restructuring and transformation charges in 2009 and 2010, respectively.
Also excludes a benefit from the 53rd week in 2010 of approximately $59 million and a gain on the sale of properties in 2011 of $30 million.
(C) Non-GAAP measure. Excludes a pretax charge of $2,784.1 million resulting from the conclusion of the arbitration with Kraft Foods Global, Inc.
(D) 2011 excludes $0.10 of gain resulting from the acquisition of the company’s joint venture operations in Switzerland and Austria and the gain on the sale of properties.
$1,997
$1.79
$0.01
7%
15.0%
$1,750
$856
Fiscal 2013 Financial Highlights
i v .