Starbucks 2013 Annual Report Download - page 54
Download and view the complete annual report
Please find page 54 of the 2013 Starbucks annual report below. You can navigate through the pages in the report by either clicking on the pages listed below, or by using the keyword search tool below to find specific information within the annual report.-
 1
1 -
2
-
3
-
4
-
5
-
6
-
7
-
8
-
9
-
10
-
11
-
12
-
13
-
14
-
15
-
16
-
17
-
18
-
19
-
20
-
21
-
22
-
23
-
24
-
25
-
26
-
27
-
28
-
29
-
30
-
31
-
32
-
33
-
34
-
35
-
36
-
37
-
38
-
39
-
40
-
41
-
42
-
43
-
 44
44 -
 45
45 -
 46
46 -
 47
47 -
 48
48 -
 49
49 -
 50
50 -
 51
51 -
 52
52 -
 53
53 -
 54
54 -
 55
55 -
 56
56 -
 57
57 -
 58
58 -
 59
59 -
 60
60 -
 61
61 -
 62
62 -
 63
63 -
 64
64 -
65
-
66
-
67
-
68
-
69
-
70
-
71
-
72
-
73
-
74
-
75
-
76
-
77
-
78
-
79
-
80
-
81
-
82
-
83
-
84
-
85
-
86
-
87
-
88
-
89
-
90
-
91
-
92
-
93
-
94
-
95
-
96
-
97
-
98
-
99
-
100
 |
 |

46
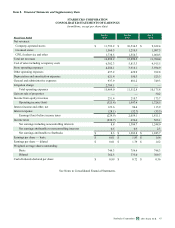
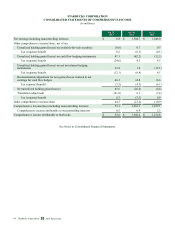
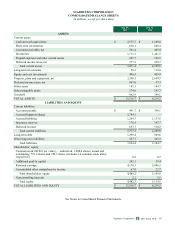
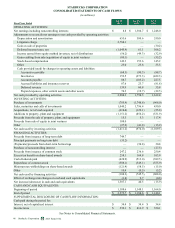
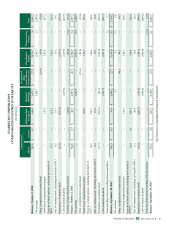
STARBUCKS CORPORATION
CONSOLIDATED STATEMENTS OF CASH FLOWS
(in millions)
Fiscal Year Ended
Sep 29,
2013
Sep 30,
2012
Oct 2,
2011
OPERATING ACTIVITIES:
Net earnings including noncontrolling interests $ 8.8 $ 1,384.7 $ 1,248.0
Adjustments to reconcile net earnings to net cash provided by operating activities:
Depreciation and amortization 655.6 580.6 550.0
Litigation charge 2,784.1 — —
Gain on sale of properties — — (30.2)
Deferred income taxes, net (1,045.9) 61.1 106.2
Income earned from equity method investees, net of distributions (56.2)(49.3)(32.9)
Gain resulting from sale/acquisition of equity in joint ventures (80.1) — (55.2)
Stock-based compensation 142.3 153.6 145.2
Other 23.0 23.6 33.3
Cash provided/(used) by changes in operating assets and liabilities:
Accounts receivable (68.3)(90.3)(88.7)
Inventories 152.5 (273.3)(422.3)
Accounts payable 88.7 (105.2) 227.5
Accrued liabilities and insurance reserves 87.6 23.7 (81.8)
Deferred revenue 139.9 60.8 35.8
Prepaid expenses, other current assets and other assets 76.3 (19.7)(22.5)
Net cash provided by operating activities 2,908.3 1,750.3 1,612.4
INVESTING ACTIVITIES:
Purchase of investments (785.9)(1,748.6)(966.0)
Sales, maturities and calls of investments 1,040.2 1,796.4 430.0
Acquisitions, net of cash acquired (610.4)(129.1)(55.8)
Additions to property, plant and equipment (1,151.2)(856.2)(531.9)
Proceeds from the sale of property, plant, and equipment 15.3 5.3 117.4
Proceeds from sale of equity in joint ventures 108.0 — —
Other (27.2)(41.8)(13.2)
Net cash used by investing activities (1,411.2)(974.0)(1,019.5)
FINANCING ACTIVITIES:
Proceeds from issuance of long-term debt 749.7 — —
Principal payments on long-term debt (35.2) — —
(Payments)/proceeds from short-term borrowings — (30.8) 30.8
Purchase of noncontrolling interest — — (27.5)
Proceeds from issuance of common stock 247.2 236.6 250.4
Excess tax benefit on share-based awards 258.1 169.8 103.9
Cash dividends paid (628.9)(513.0)(389.5)
Repurchase of common stock (588.1)(549.1)(555.9)
Minimum tax withholdings on share-based awards (121.4)(58.5)(15.0)
Other 10.4 (0.5)(5.2)
Net cash used by financing activities (108.2)(745.5)(608.0)
Effect of exchange rate changes on cash and cash equivalents (1.8) 9.7 (0.8)
Net increase/(decrease) in cash and cash equivalents 1,387.1 40.5 (15.9)
CASH AND CASH EQUIVALENTS:
Beginning of period 1,188.6 1,148.1 1,164.0
End of period $ 2,575.7 $ 1,188.6 $ 1,148.1
SUPPLEMENTAL DISCLOSURE OF CASH FLOW INFORMATION:
Cash paid during the period for:
Interest, net of capitalized interest $ 34.4 $ 34.4 $ 34.4
Income taxes $ 539.1 $ 416.9 $ 350.1
See Notes to Consolidated Financial Statements.
2013 10-K
Starbucks Corporation Form